This page covers the usage of iTOL annotation editor for Microsoft Excel. For details on installation and usage of other versions, please visit their corresponding help pages:
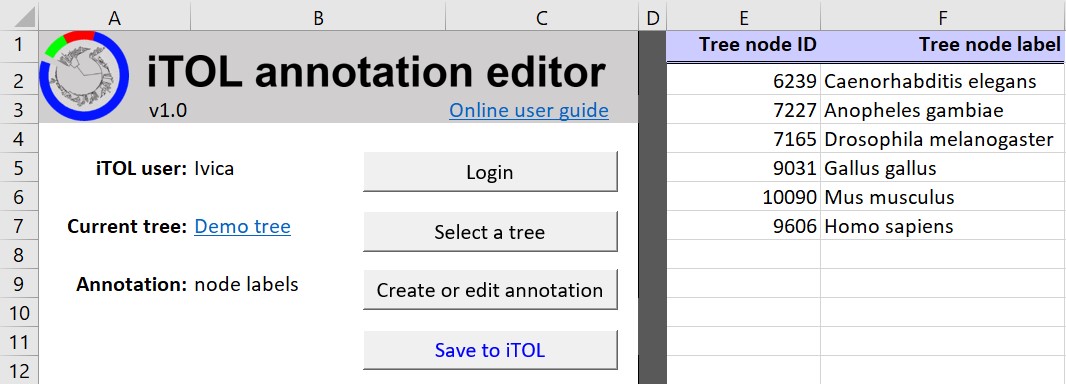
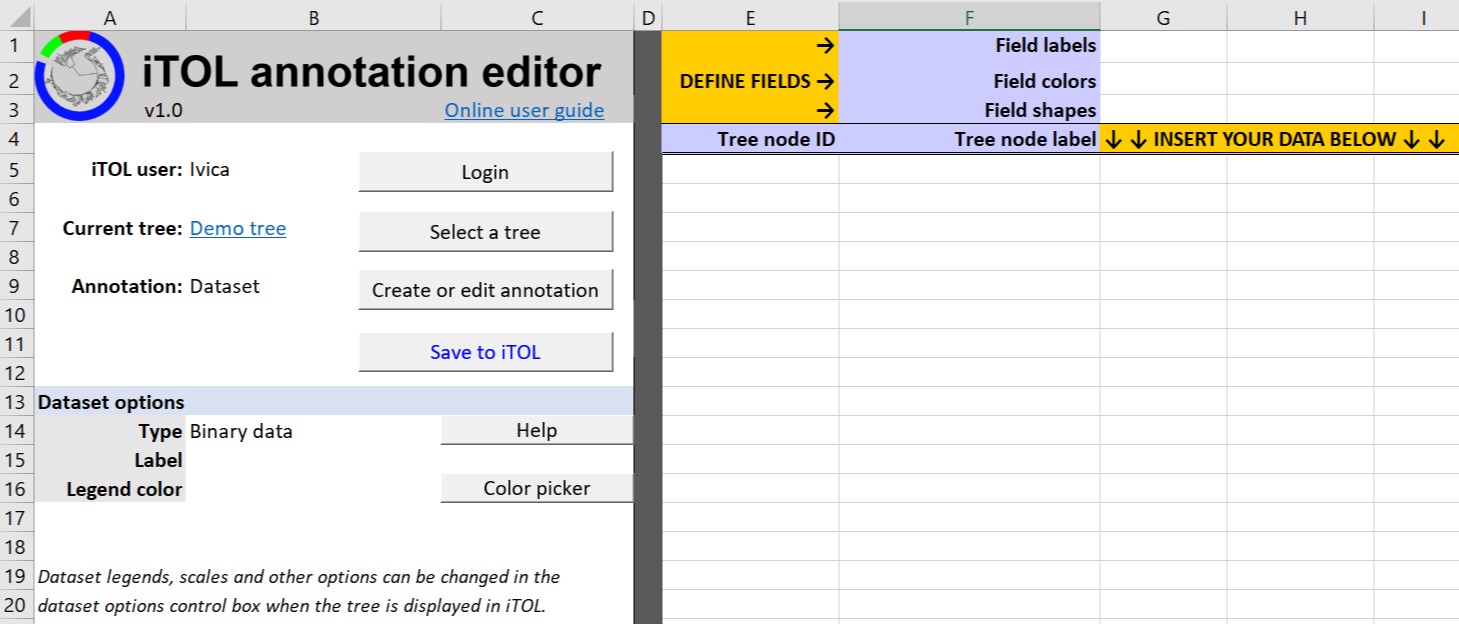
Open the iTOL annotation editor XLSM file in Excel. You will see a spreadsheet shown on the right. Feel free to create additional sheets in the file, but make sure that iTOL editor remains as the first sheet. Columns A - D are reserved for editor functions, while the main data input area starts with column E:
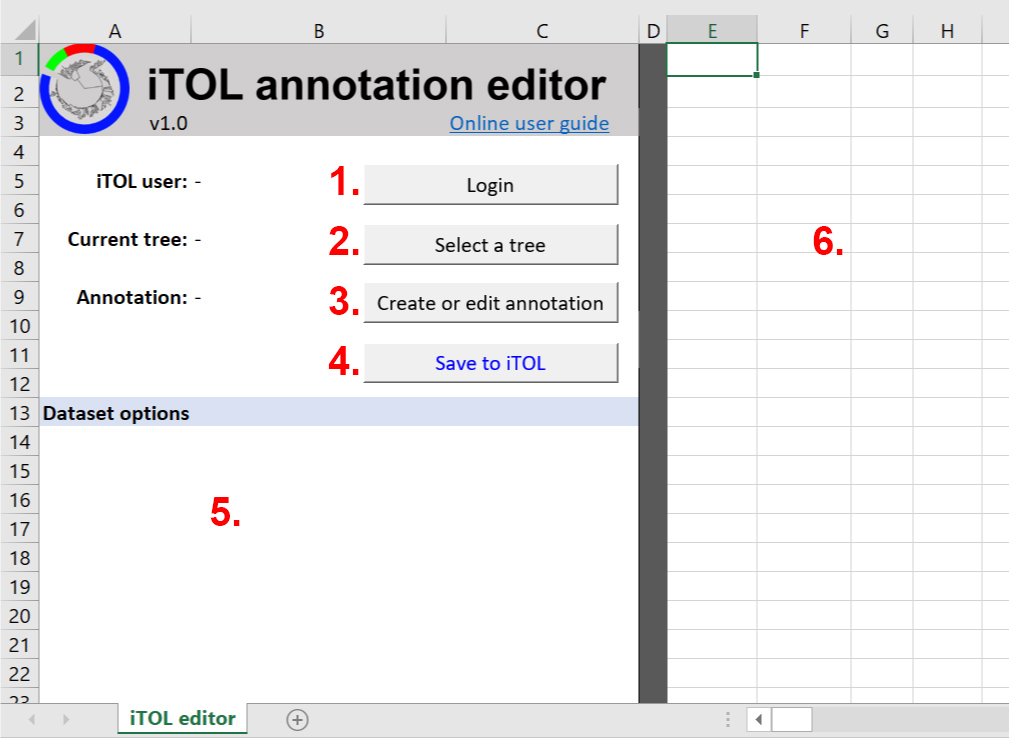
Annotation editor user interface
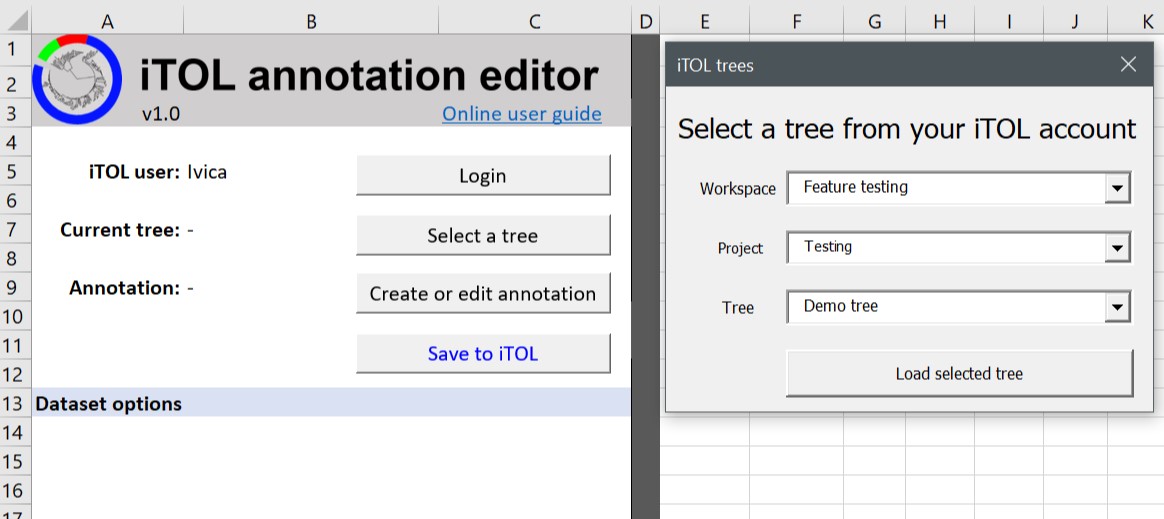
Selecting a tree from your iTOL account
After selecting a tree from your account, click the 'Create or edit annotation' button to display the dialog shown on the right. It consists of 5 tabs:
There are two checkboxes available:
Select the desired function and click the button in the annotation selector to initialize the sheet editing area and the dataset options.
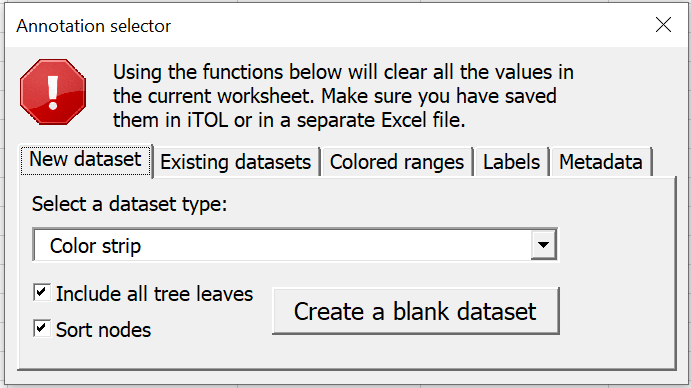
Annotation selector
After selecting the annotation type to edit, the editing area will contain the header describing the columns. Column E will always contain the tree node IDs. Type the node ID you wish to annotate into column E, and fill other columns as required (depending on the dataset type, described below).
If you pre-loaded the tree leaf IDs from iTOL, or if you are editing an existing dataset, column F will contain the current node labels (which can differ from the ID). These are displayed for your information only, and do not need to be filled otherwise. If you wish to edit the actual labels, use the 'Labels' tab in the Annotation selector.
When finished with editing, click the Save to iTOL button. If editing an existing dataset or tree labels, a warning message will be shown, to prevent you from accidentally overwriting the current data in iTOL.
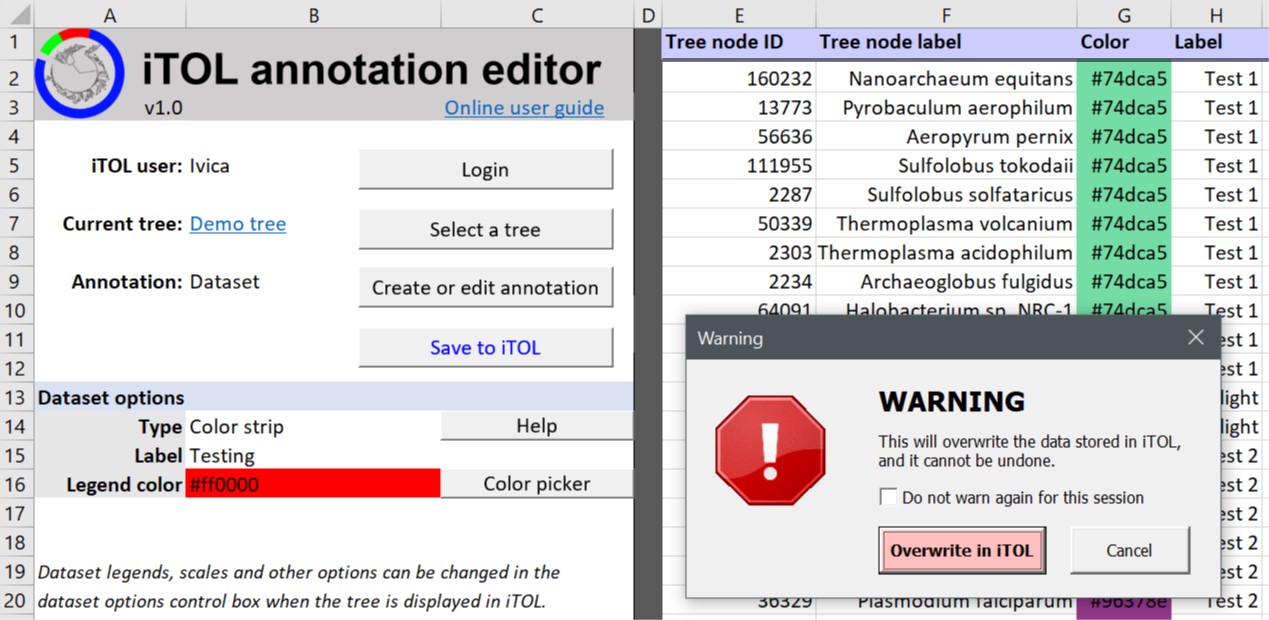
Data overwrite warning
If you don't have an active subscription or institutional access, iTOL annotation editor will function in trial mode. All functions are available for testing, with one important limitation: only the first 5 rows of your data will be processed and saved on the iTOL server. Existing data in iTOL will be overwritten with these 5 rows, and the rest will be deleted. For example, if you are editing the labels on a large tree, only the first five labels will be saved, and the rest will be gone.
In trial mode, please use separate trees and data uploaded specifically for evaluating the iTOL annotation editor, since data truncation could occur.
To get full unlimited access, visit your iTOL account page.
For unlimited institutional access, have your librarian or other responsible person get in touch with us.
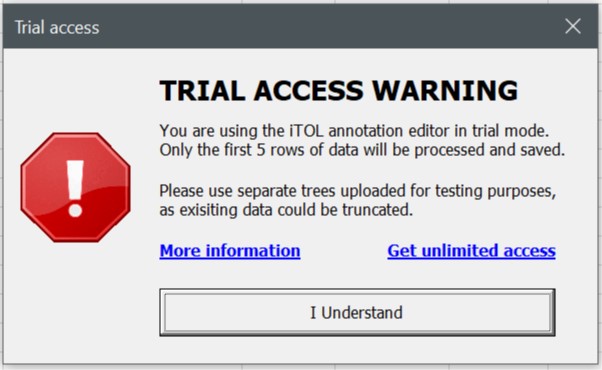
Trial usage warning
Select Labels tab in the Annotation selector and load the tree labels into Excel. Tree IDs will be in column E, and their corresponding label in column F. To assign labels to internal nodes, use iTOL's last common ancestor method, if your tree does not have internal node IDs present. Alternatively, you can click on any node in the iTOL web tree display, and click the node ID on the bottom of the popup to copy it to your clipboard. Paste it into the Tree node ID column, and assign the desired label.
Editing tree labels
Select Metadata tab in the Annotation selector and load the node metadata into the active sheet. Tree IDs will be in column E, and their corresponding label in column F. Each node can have multiple associated metadata fields, which you have to define in the header starting with column G.
To assign metadata to internal nodes, use iTOL's last common ancestor method, if your tree does not have internal node IDs present. Alternatively, you can click on any node in the iTOL web tree display, and click the node ID on the bottom of the popup to copy it to your clipboard. Paste it into the Tree node ID column, and assign the metadata into the corresponding columns (from G onwards).
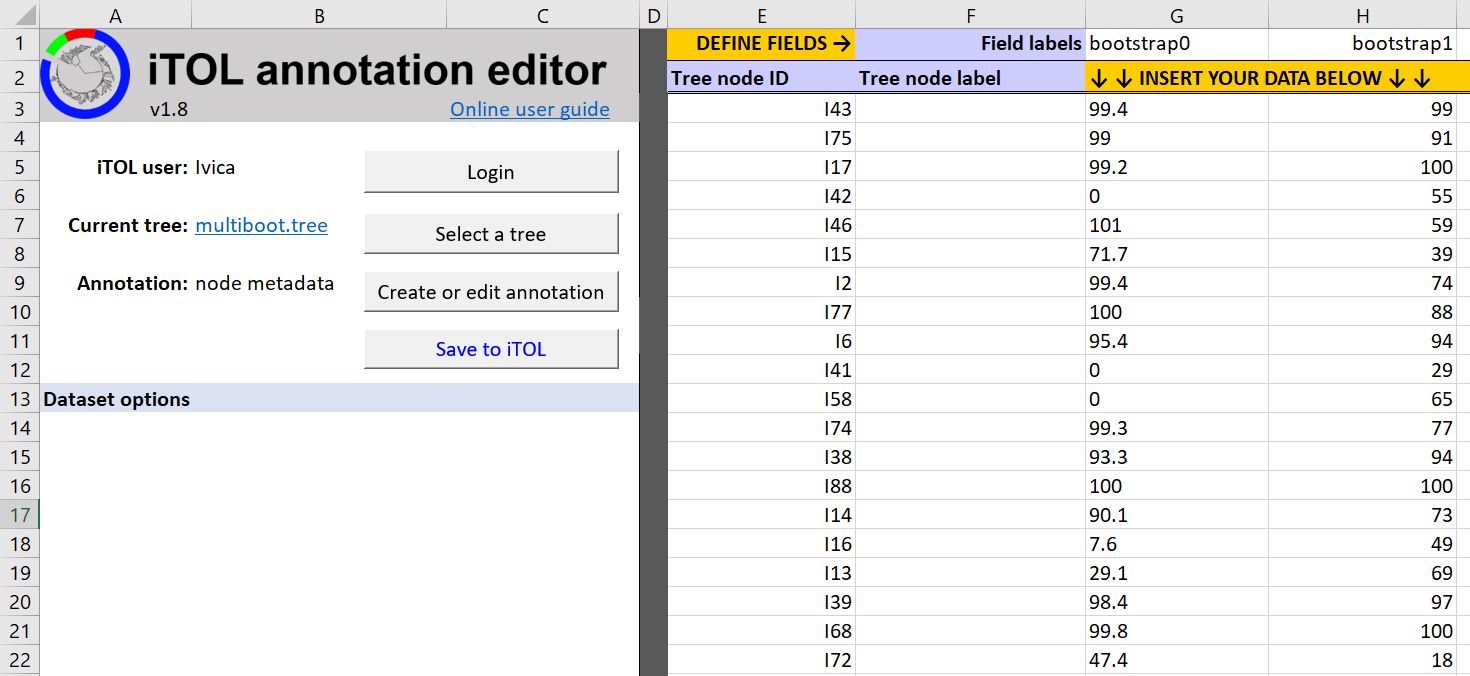
Editing node metadata
Note that these legacy colored ranges have been deprecated. New Colored/labeled ranges dataset offers the same features, with many additional functions.
Select Colored ranges tab in the Annotation selector and load the current ranges into Excel, or to initialize an empty color range input sheet. Tree IDs have to be entered into column E, and their corresponding range color into column G. You can also provide the label for the colored range in column H.
To assign colored ranges to internal nodes/clades , use iTOL's last common ancestor method, if your tree does not have internal node IDs present (row 4 in the example on the right). Alternatively, you can click on any node in the iTOL web tree display, and click the node ID on the bottom of the popup to copy it to your clipboard. Paste it into the Tree node ID column, and assign the desired colored range.
Whenever you need to provide a color annotation, you can type it directly into the cell, using any iTOL supported format ( hexadecimal, RGB or RGBA). Alternatively, you can use the Color picker button in field C16. Select a cell where you need a color, and click the Color picker button. After selecting a color, its hex code will be entered into the active cell, and the cell background will reflect the selected color.
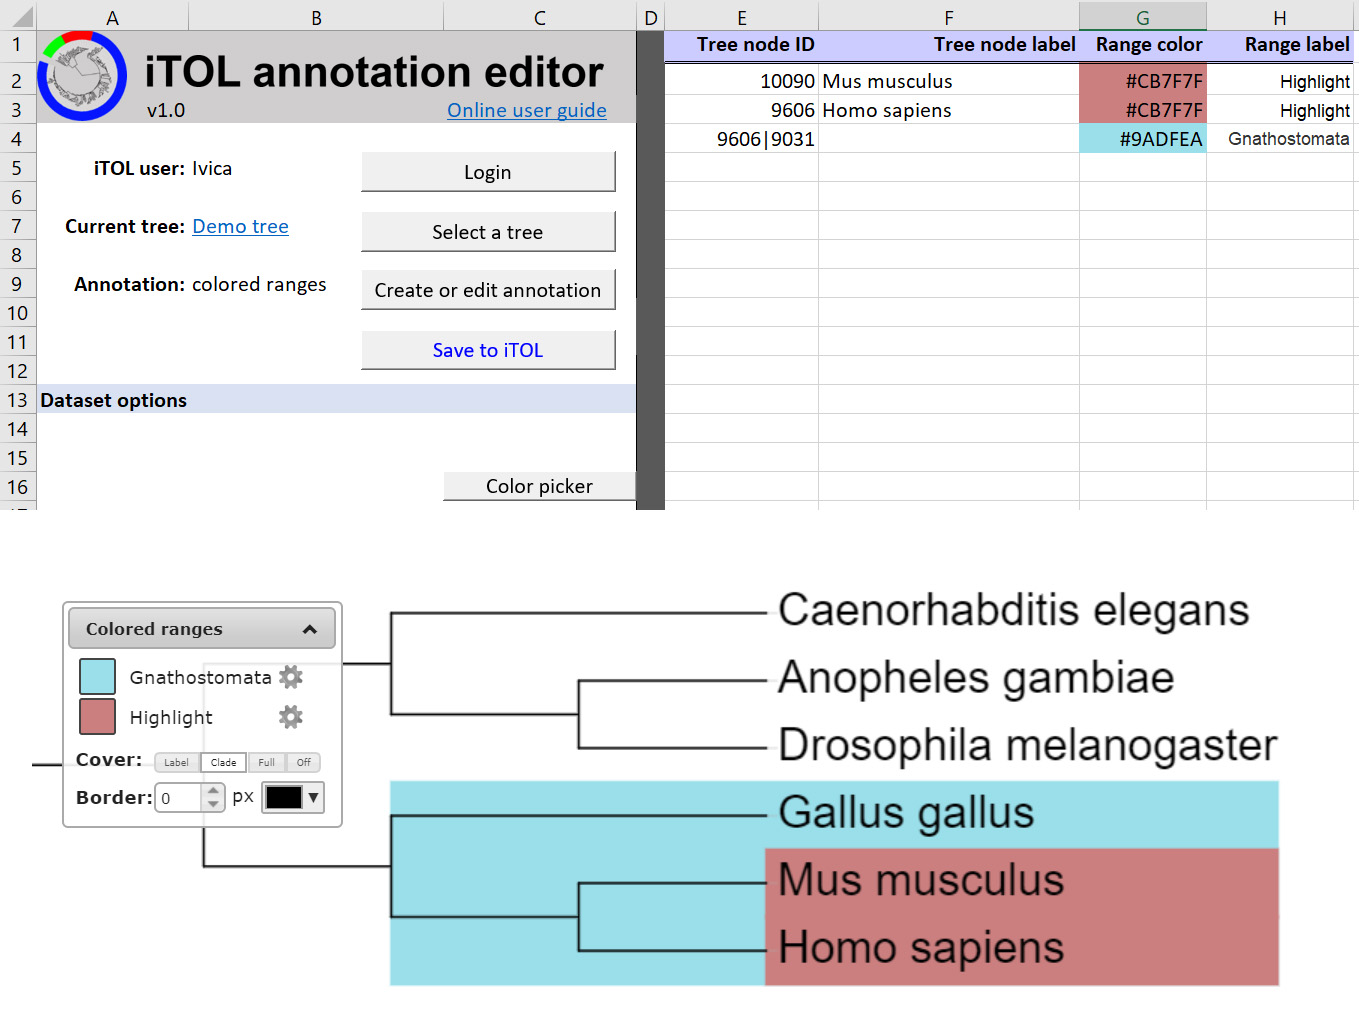
Editing colored ranges
To create a new blank dataset, go to the New dataset tab in the Annotation selector, choose the desired dataset type and options, and click Create a blank dataset.
If your tree already has some datasets present, you can load and edit them through the Existing datasets tab.
Tree IDs have to be entered into column E, and their corresponding data into columns G and onward, depending on the dataset type. To assign data to internal nodes/clades , use iTOL's last common ancestor method, if your tree does not have internal node IDs present. Alternatively, you can click on any node in the iTOL web tree display, and click the node ID on the bottom of the popup to copy it to your clipboard. Paste it into the Tree node ID column, and assign the data as required.
Dataset label and legend color must be set (or can be changed for existing datasets) in cells B15 and B16
Blank dataset template
In colored strip datasets, each node is associated to a color box/strip and can have an optional label. Similar to all other color definitions in iTOL, color can be specified in hexadecimal, RGB or RGBA notation (if transparency is required). You can type the colors directly into column G, or use the color picker.
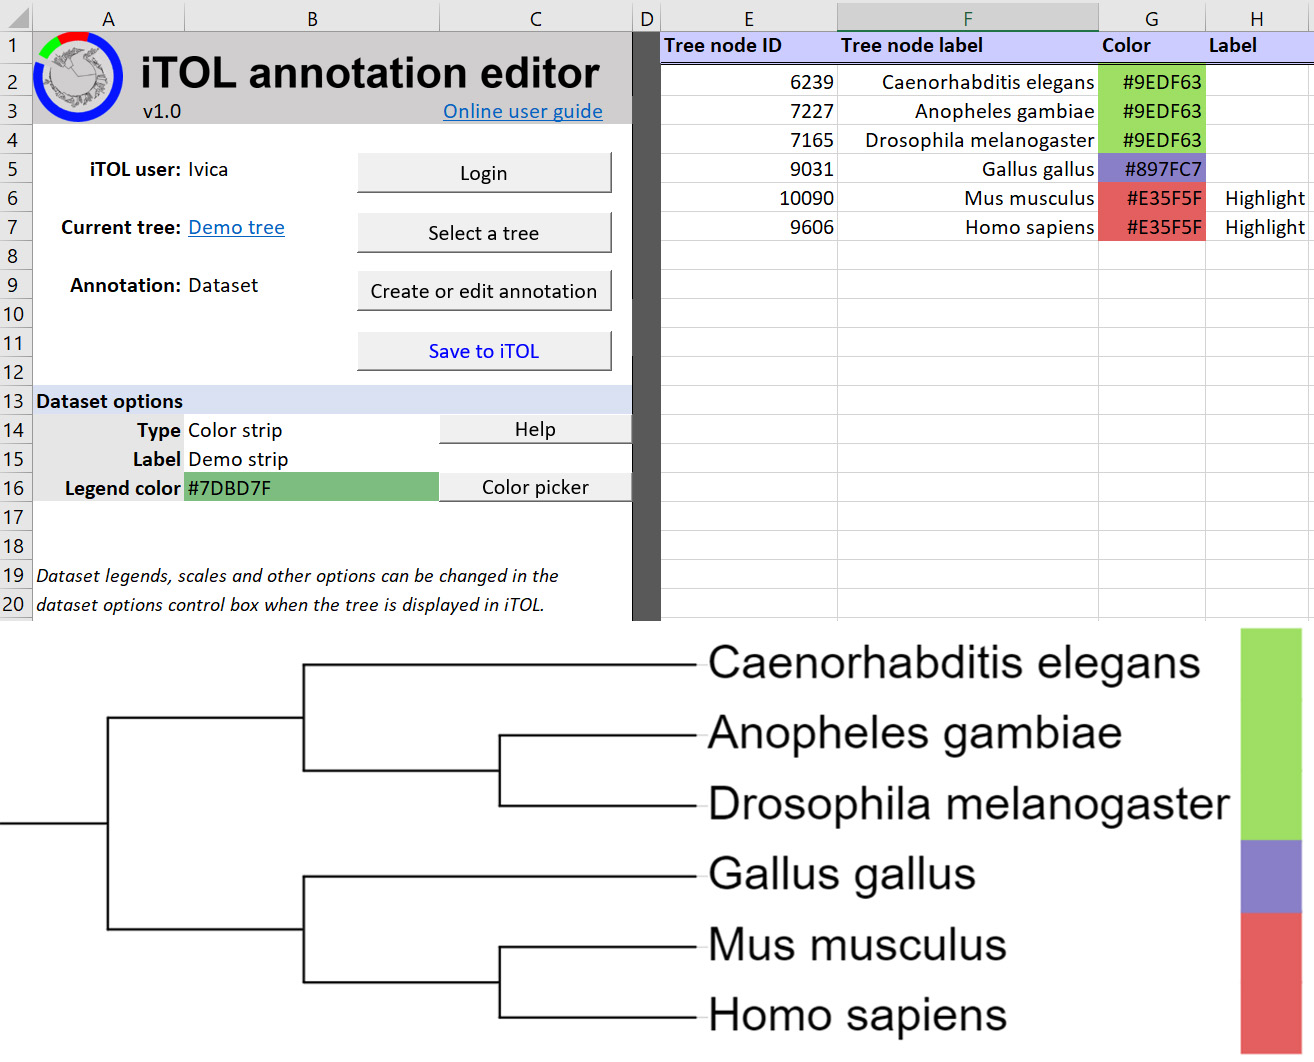
Example colored strip
In color gradient datasets, each node is associated to a single numeric value, which is mapped to a colored box on the tree. Colors corresponding to the minimum and maximum values (plus optionally the midpoint value) are defined in the iTOL controls box when the dataset is displayed. In the example on the right minimum value is displayed in red, and the maximum in blue.
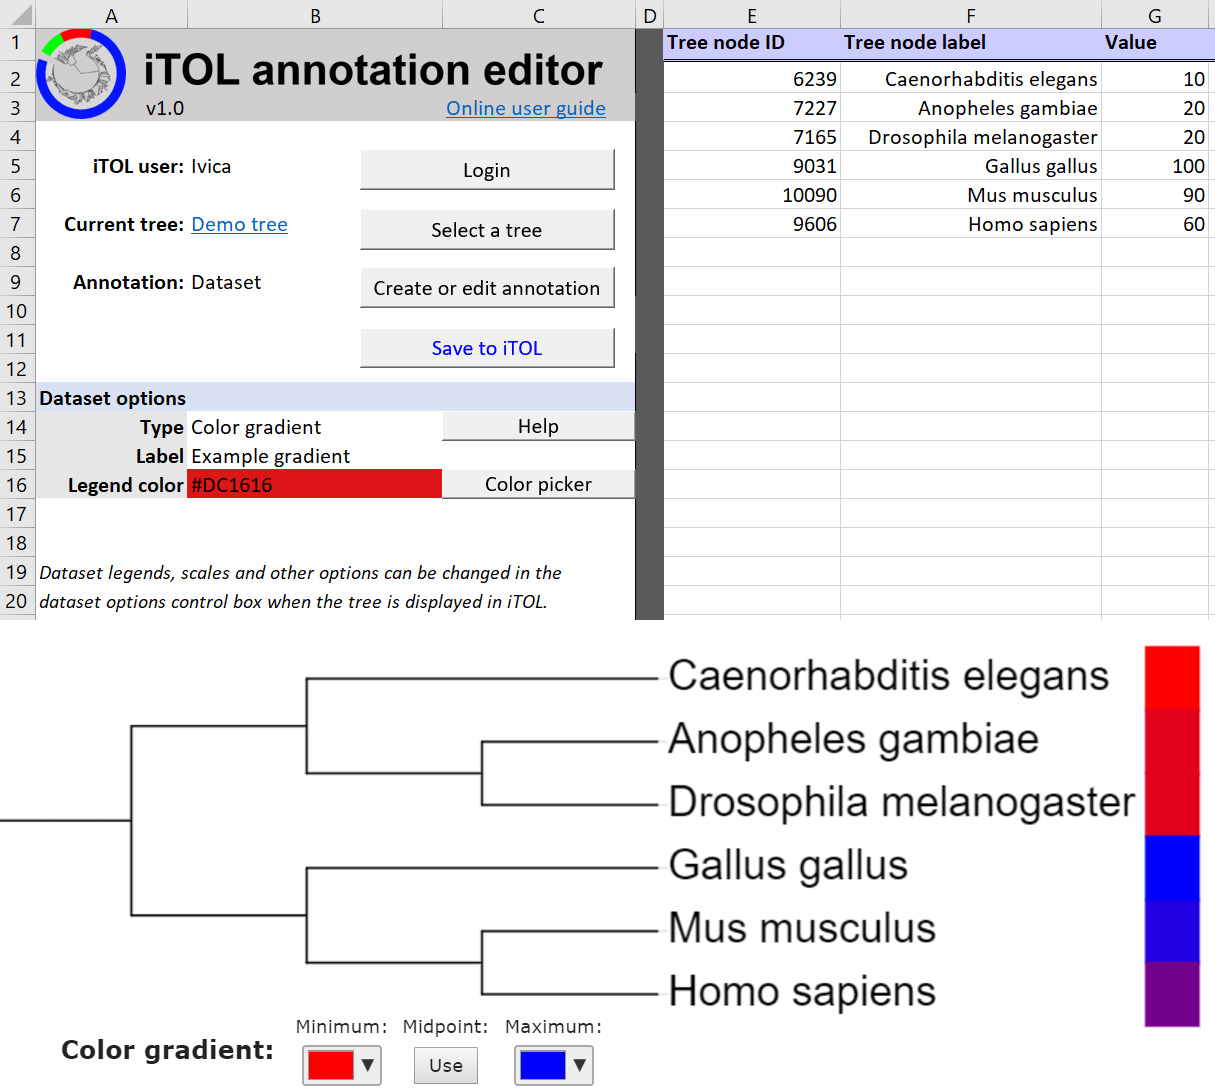
Example color gradient
Use this dataset type to highlight various clades or leaf ranges by using colored boxes or brackets. Ranges are defined through start and end IDs (columns E and G), and their corresponding style into columns H and onward.
Column descriptions:
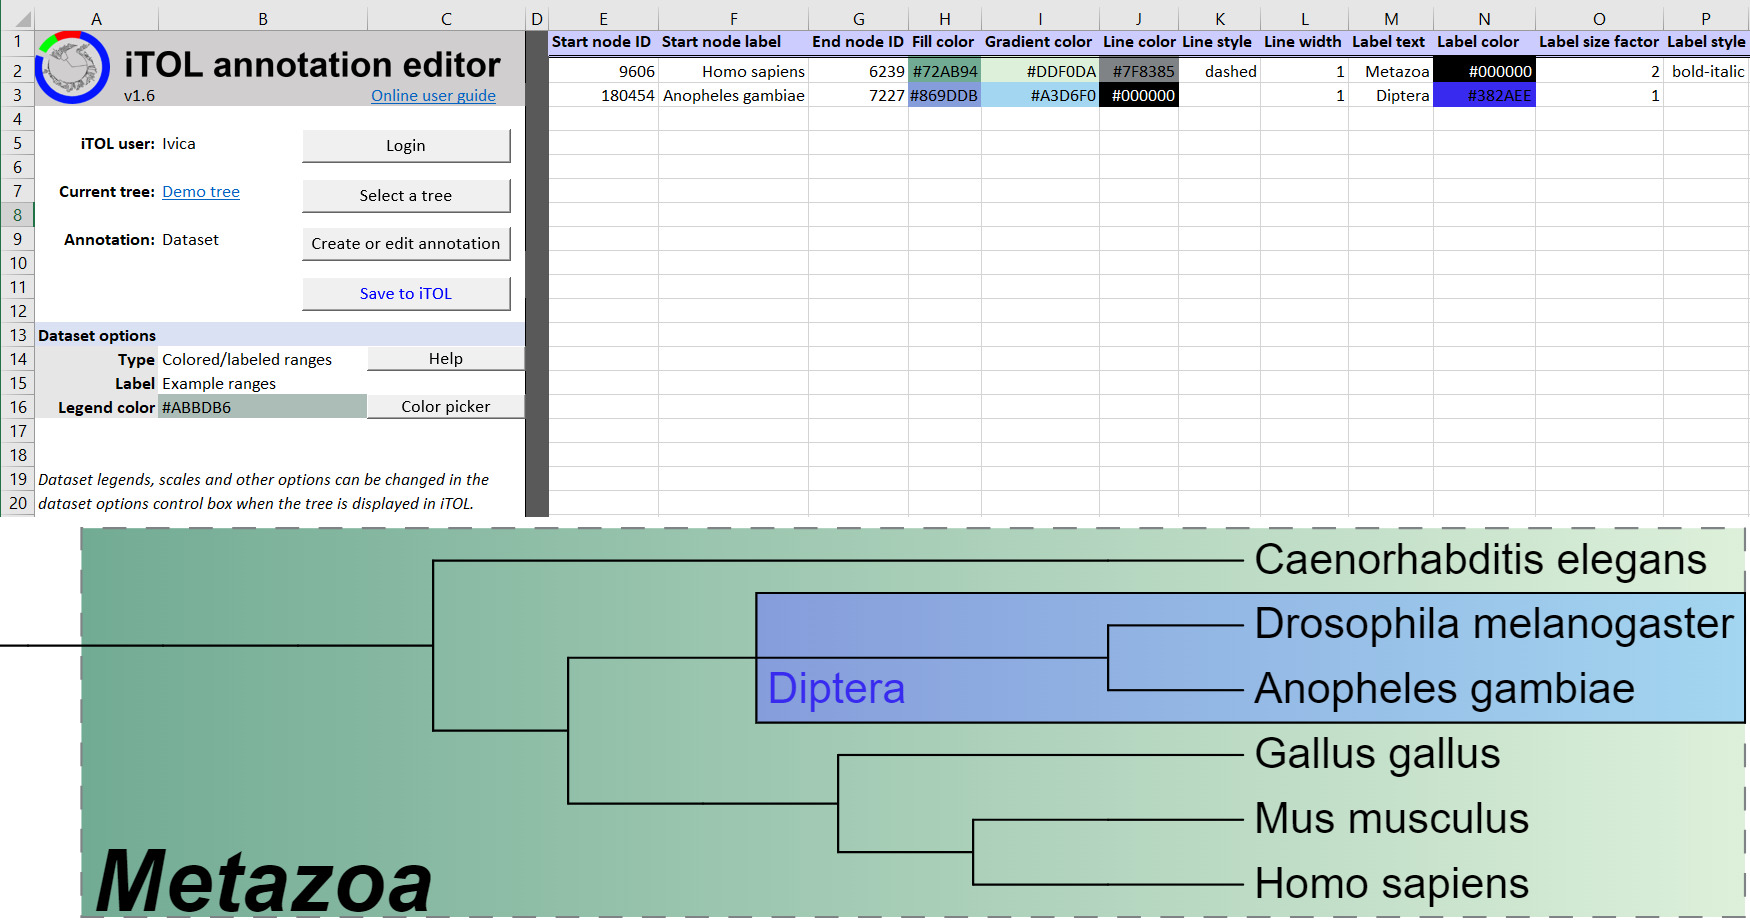
Example colored ranges dataset
This dataset type allows the customization of colors and display styles for tree branches and leaf labels. Tree IDs have to be entered into column E, and their corresponding data into columns G and onward. To assign styles to whole clades , use iTOL's last common ancestor method, if your tree does not have internal node IDs present. Alternatively, you can click on any node in the iTOL web tree display, and click the node ID on the bottom of the popup to copy it to your clipboard. Paste it into the Tree node ID column, and assign the style as desired.
Column descriptions:
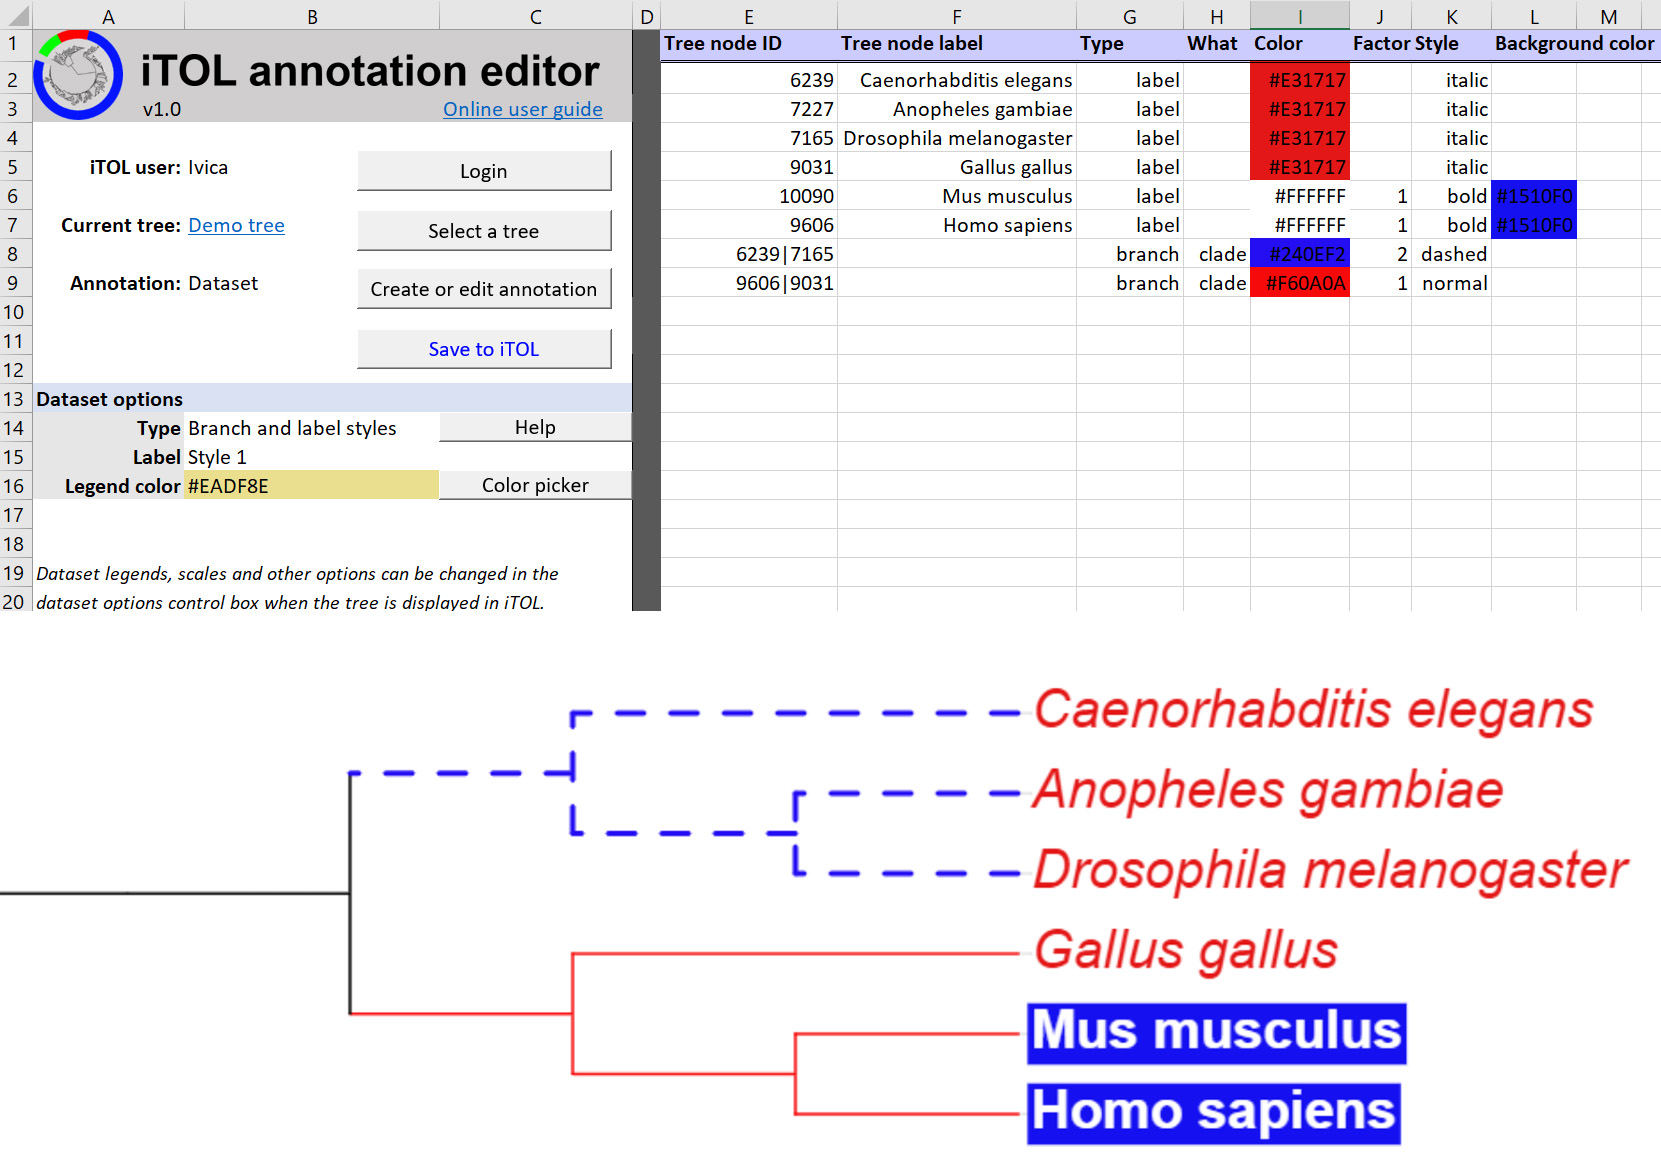
Example branch and label styles
Binary datasets are visualized as filled or empty symbols, depending on the value associated with a node (0 or 1). Each node can have multiple associated fields, which you have to define in the header starting with column G. For each field, provide the label in in row 1, color in row 2 and select the desired shape in row 3. After defining the fields, start filling the data in the row 5 and below. Possible values for each node are:
| 1 : | filled shape |
| 0 : | empty shape |
| -1 : | shape completely omitted |
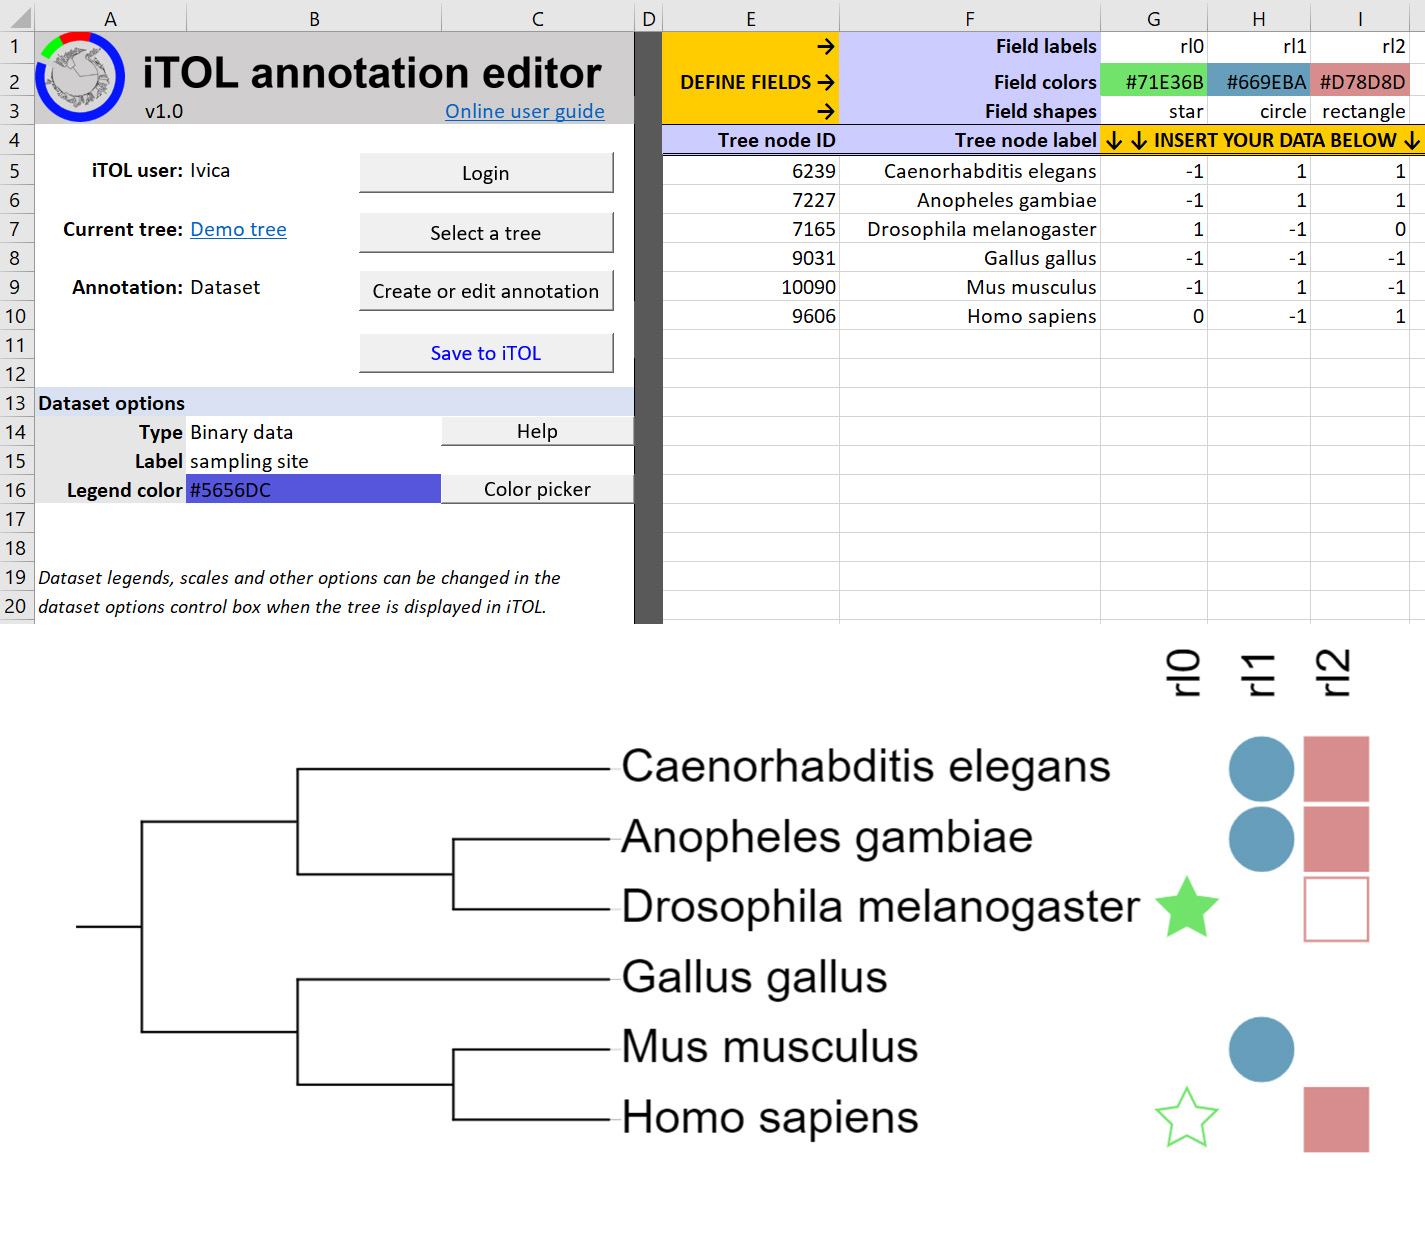
Example binary dataset
In simple bar charts, each node is associated to a single numeric value which is displayed as a bar outside the tree. Bars will use the same color as the dataset legend (setting in cell B16).
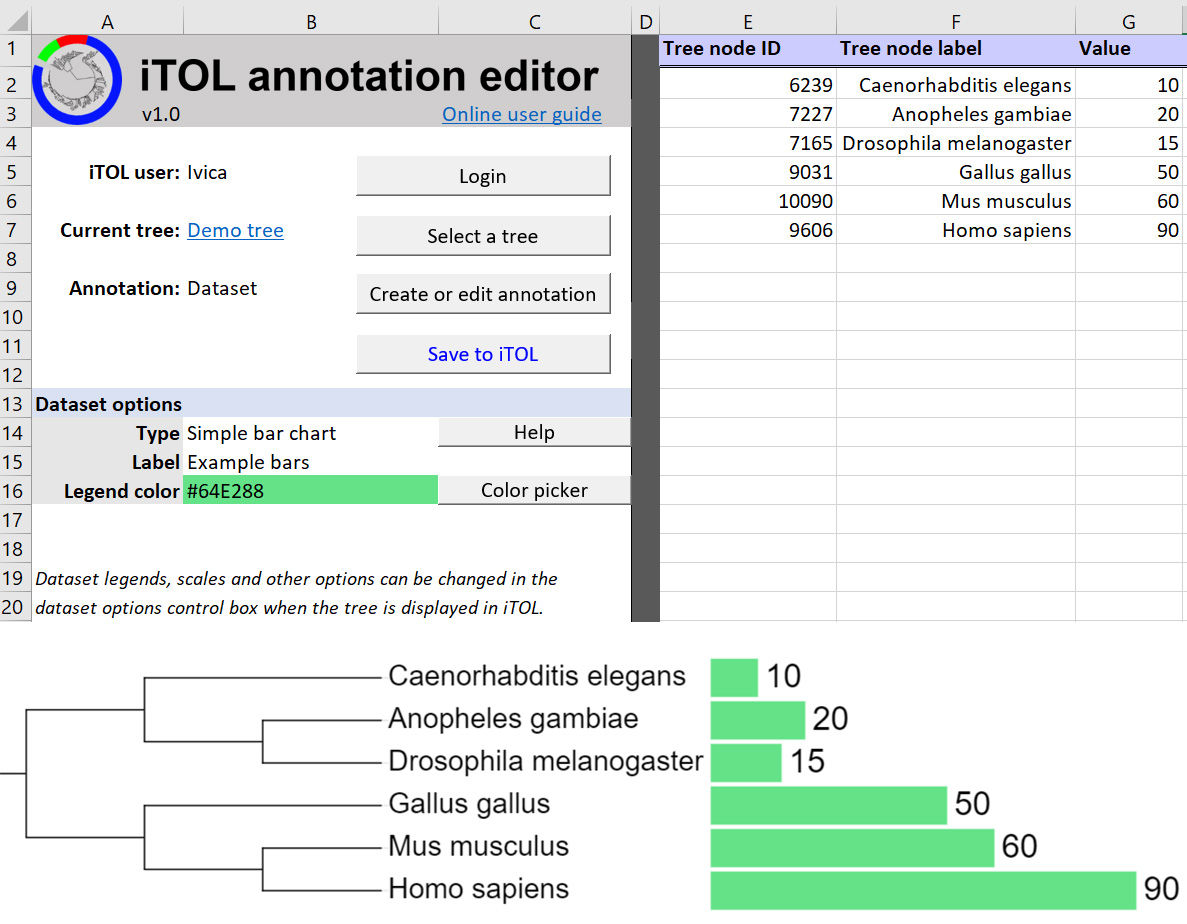
Example simple bar chart
In multi-value bar charts, each node is associated to multiple numeric values, which are displayed as a stacked or aligned bar chart outside the tree. First, you have to define the fields in the header starting with column G. For each field, provide the label in row 1 and its color in row 2. After defining the fields, start filling the data in the row 4 and below.
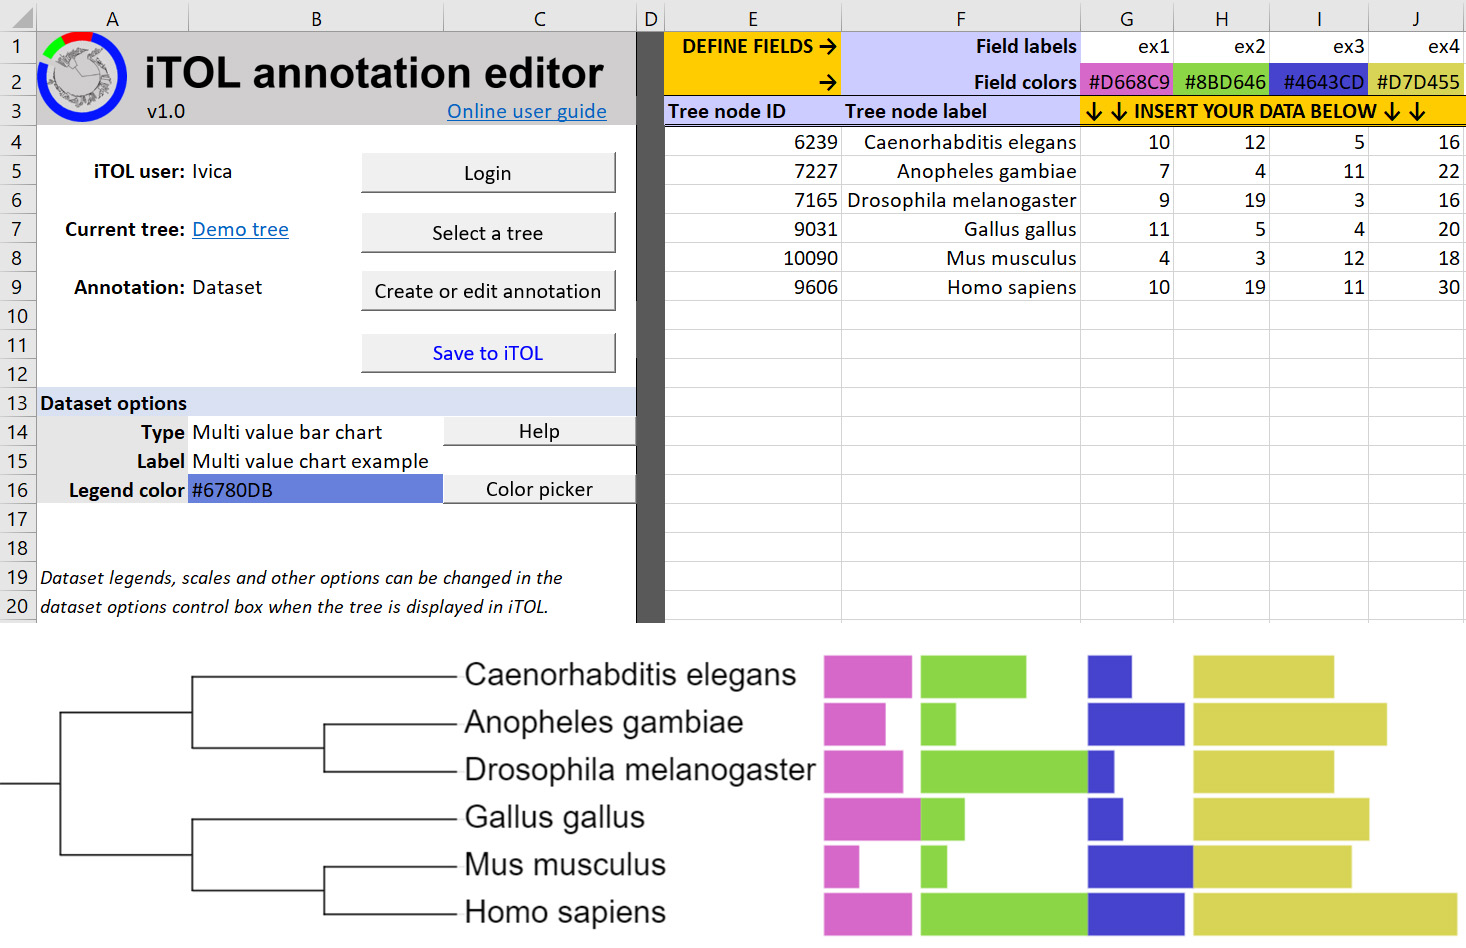
Example multi value bar chart
In pie chart datasets, each node is associated to multiple numeric values, which are displayed as a pie chart directly on the node branch, or outside the tree. First, you have to define the piechart fields in the header starting with column I. For each field, provide the label in row 1 and its color in row 2. After defining the fields, start filling the field data in rows 4 and below. In addition to the pie chart values, you have to fill two columns for each node:
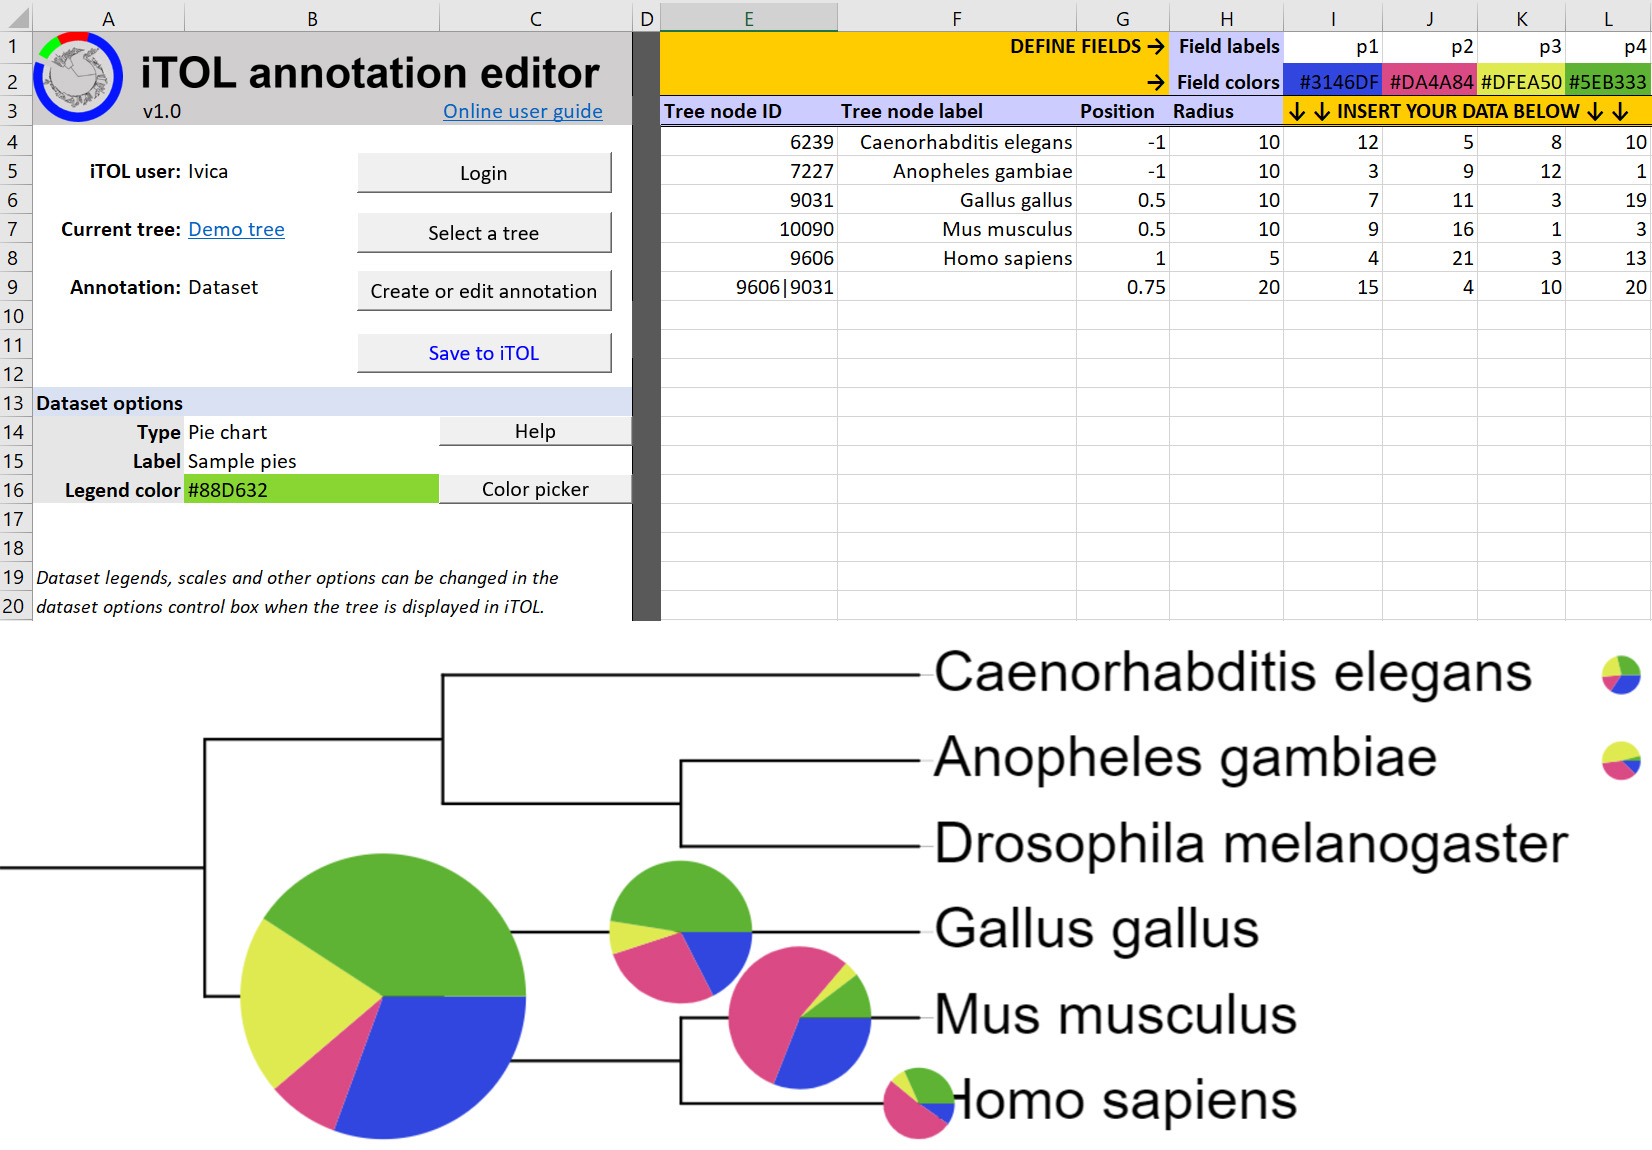
Example pie charts
In heatmaps, each node is associated to multiple numeric values, which are displayed as a set of colored boxes. Values are mapped to a color gradient defined in the dataset options when the dataset is visible in iTOL. Specify missing or null values using the letter 'X'. First, you have to define the fields in the header starting with column G. For each field, provide the label in row 1. After defining the fields, start filling the data in the row 3 and below.
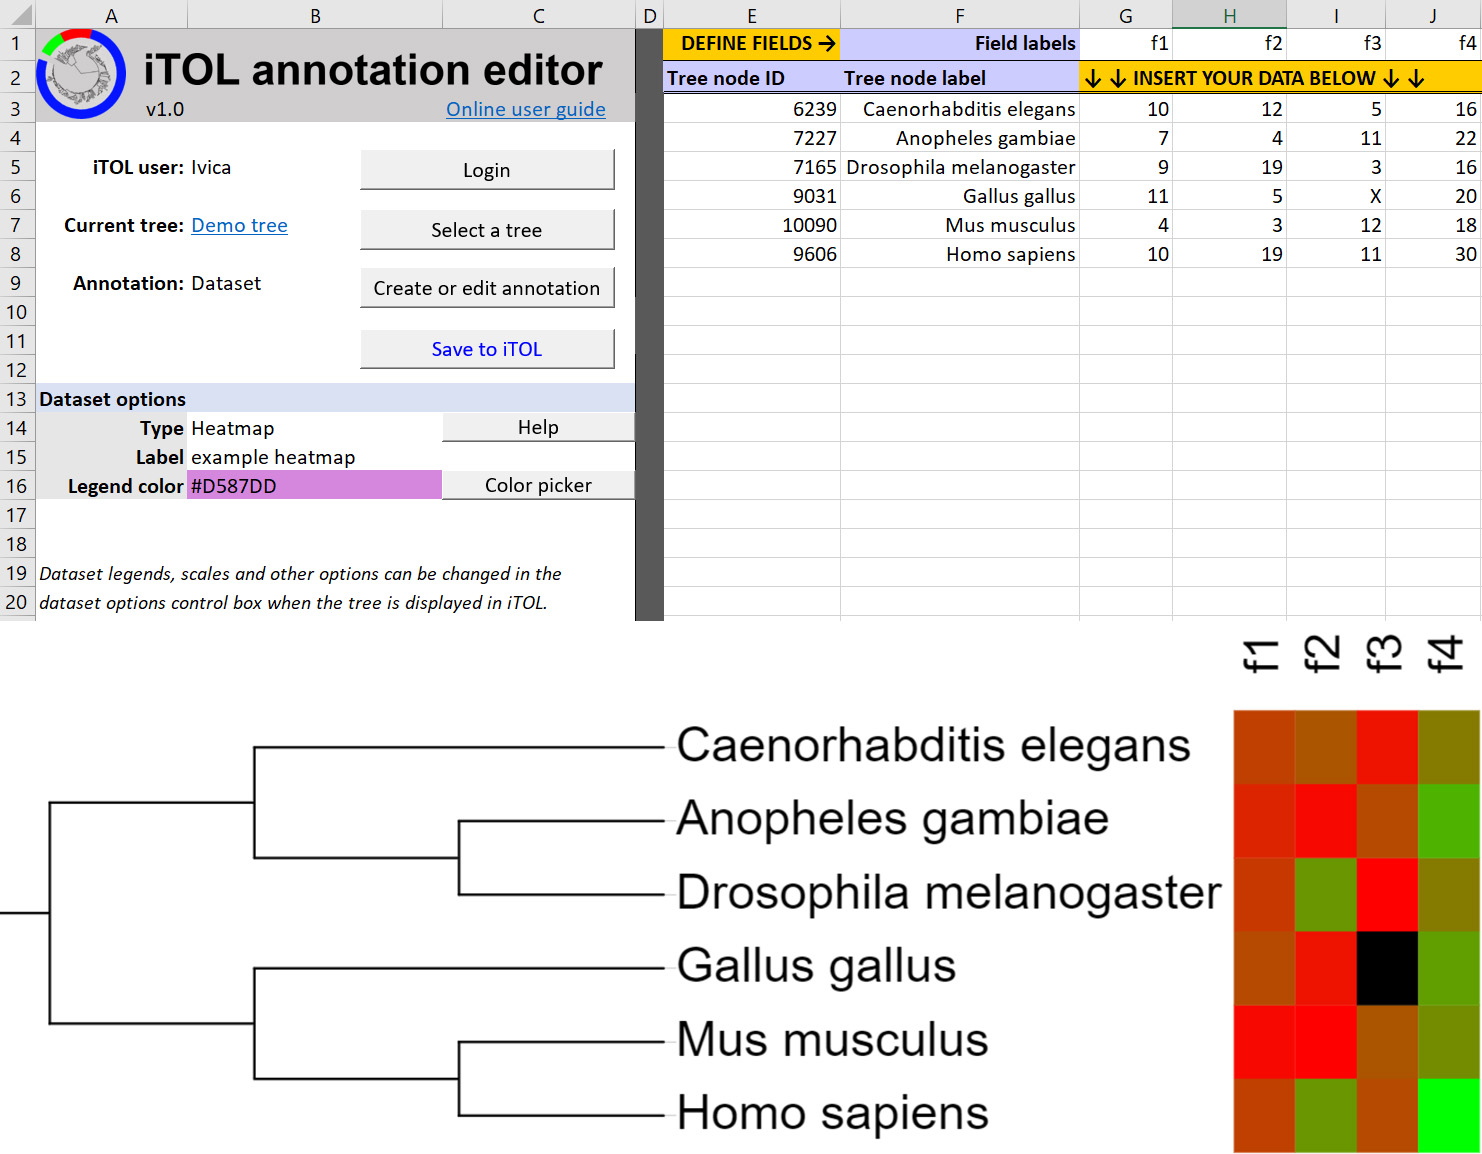
Example heatmap
In text label datasets, each node is associated to a single text label, which can be displayed directly on the node branch, or outside the tree. For each label, exact position, color, font style, size factor and degree of rotation can be specified.
Column descriptions:
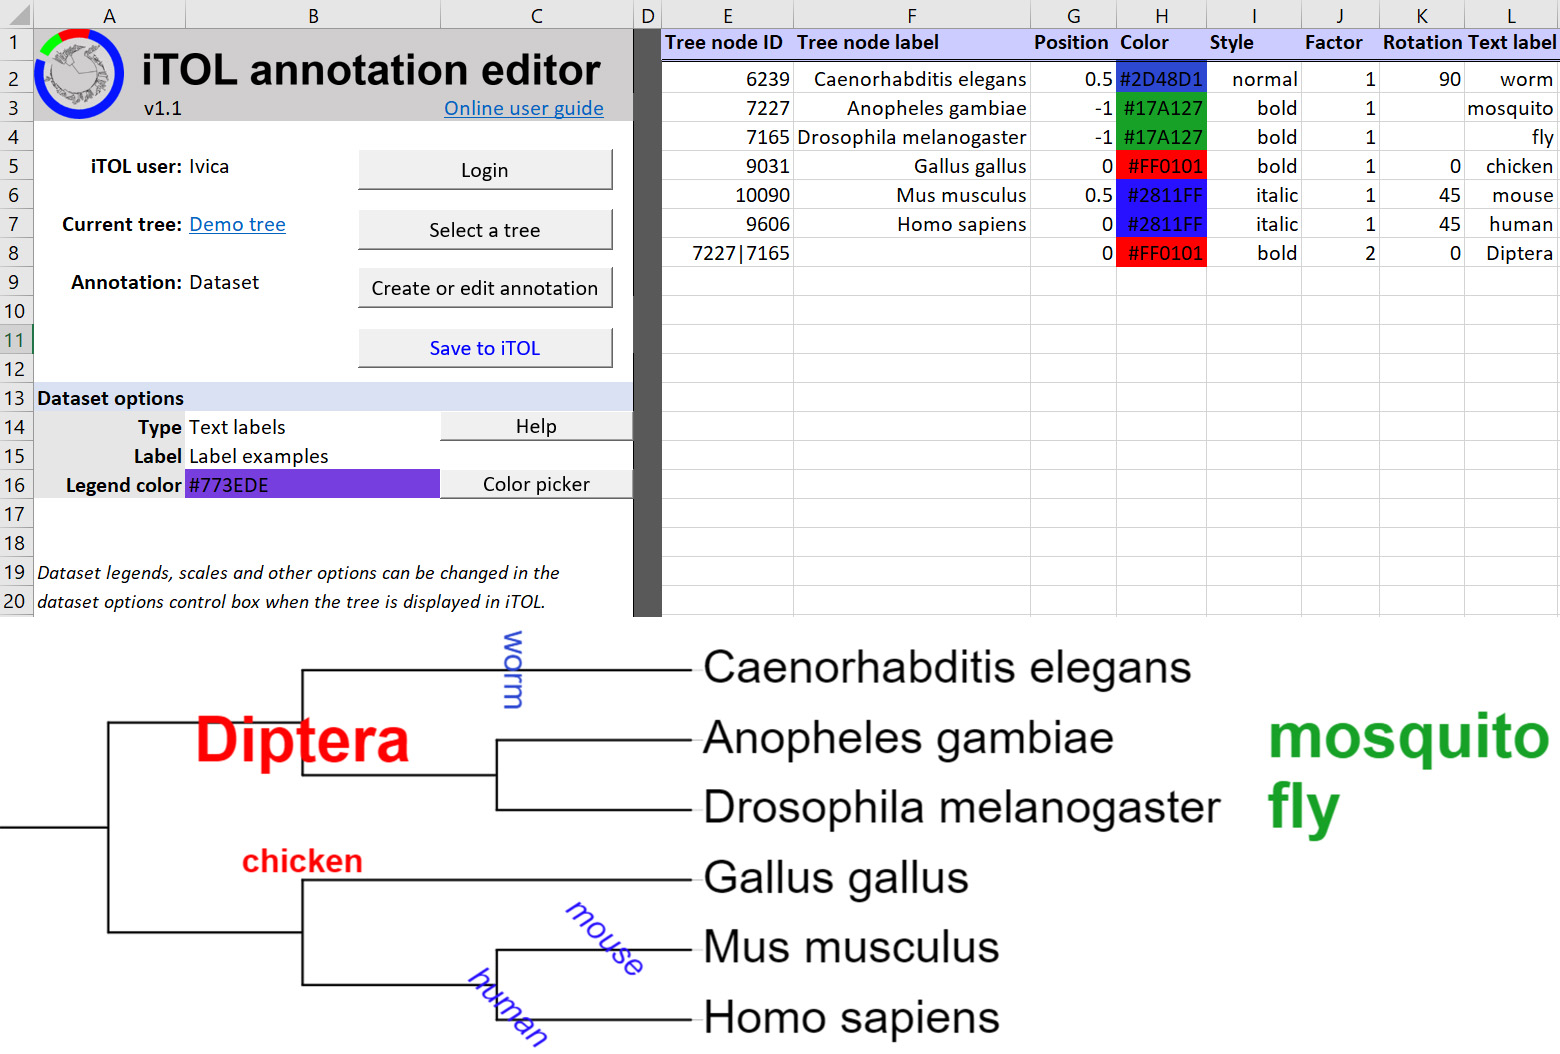
Example text labels
Connections datasets allow the drawing of straight or curved lines between any two nodes in the tree. Width, color and style (normal or dashed) can be set for each line. Optionally, arrow heads can be displayed on the lines.
Column descriptions:
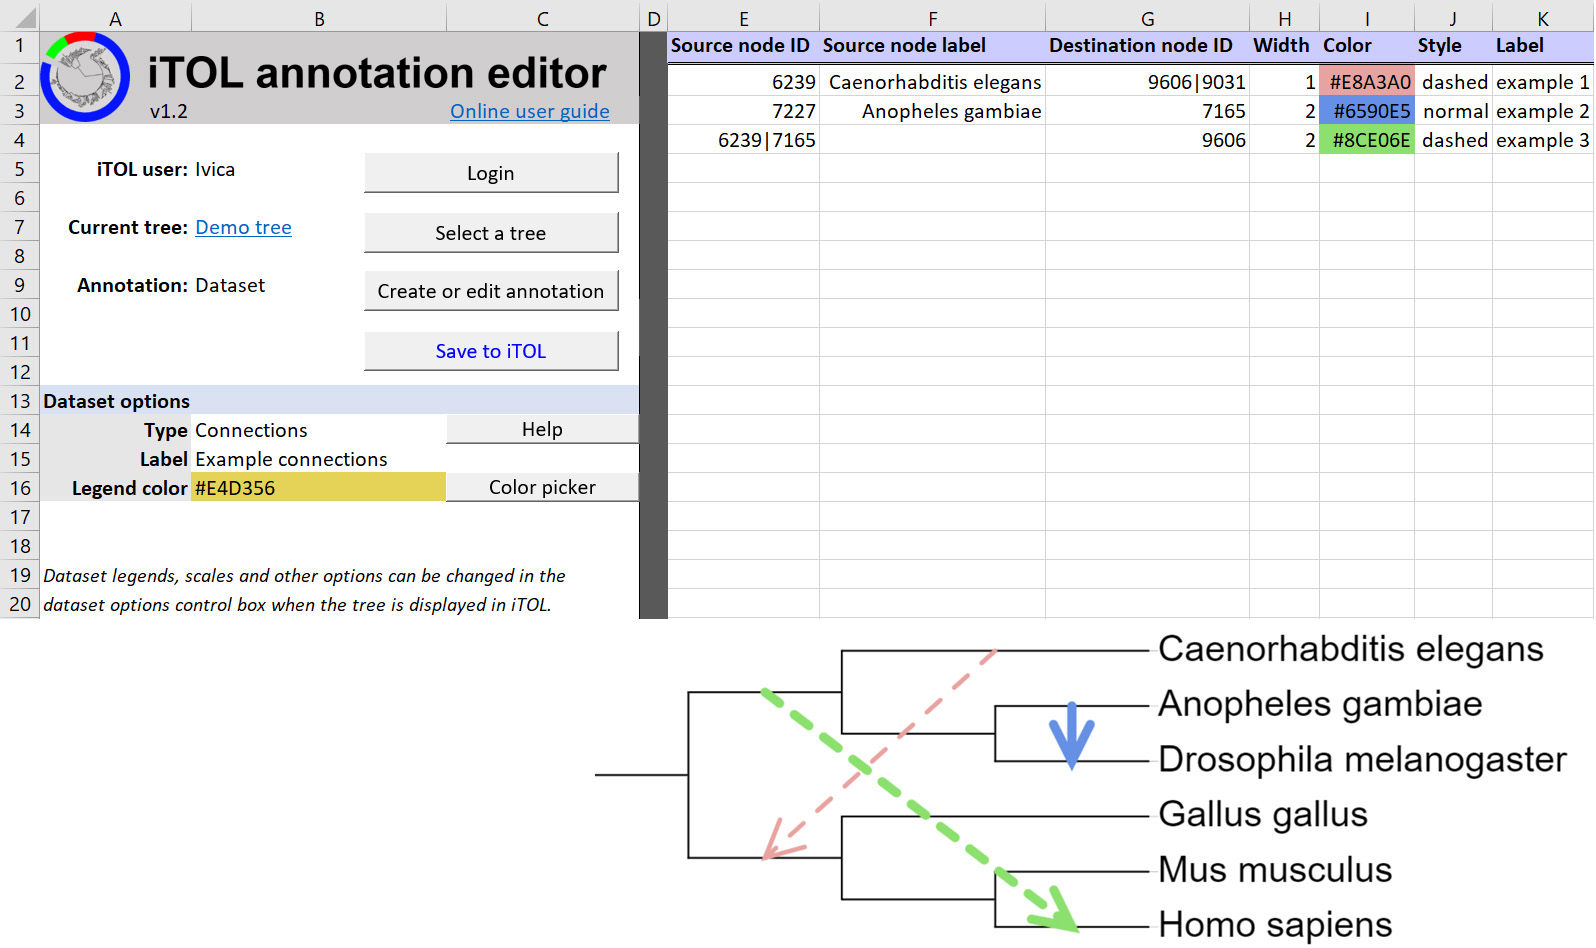
Example connections
In shape plots, each node has multiple numeric values associated with it. Values will be displayed as geometric shapes of different sizes in consecutive columns outside the tree. Highest value in the dataset will have the largest size, and all others will be scaled down proportionally.
First, you have to define the fields in the header starting with column G. For each field, provide the label in row 1 and its color in row 2. After defining the fields, start filling the data in the row 4 and below.
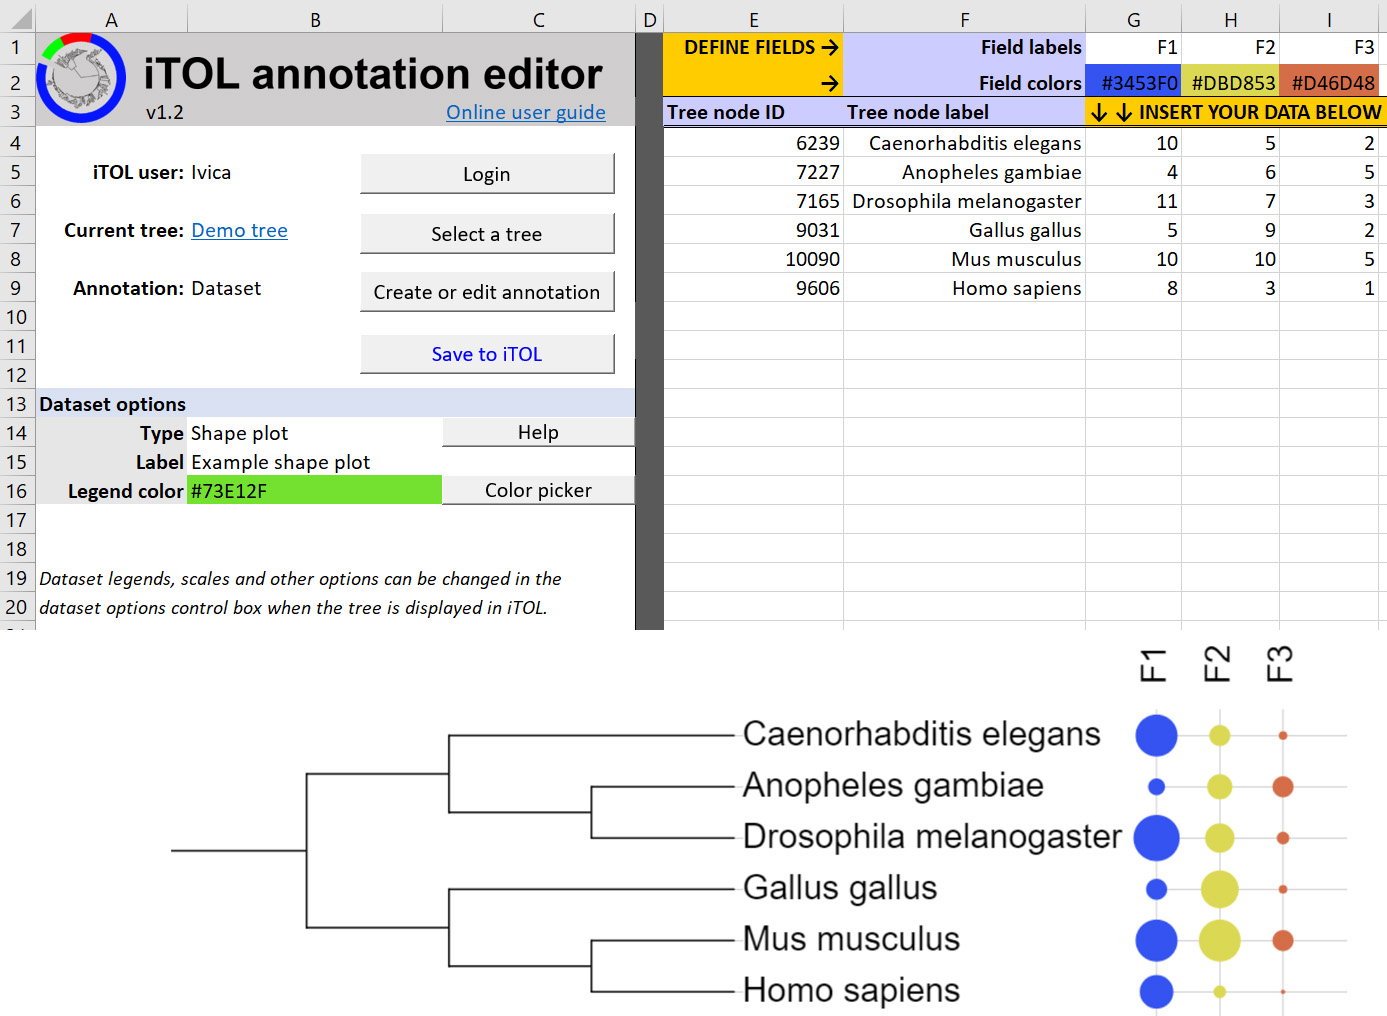
Example shape plot
Symbol datasets allow the display of various shapes directly on the branches of the tree. For each node, one or more symbols can be defined. Each symbol's color, size and position along the branch can be specified. Symbols can be filled with color, or drawn as outlines.
Column descriptions:
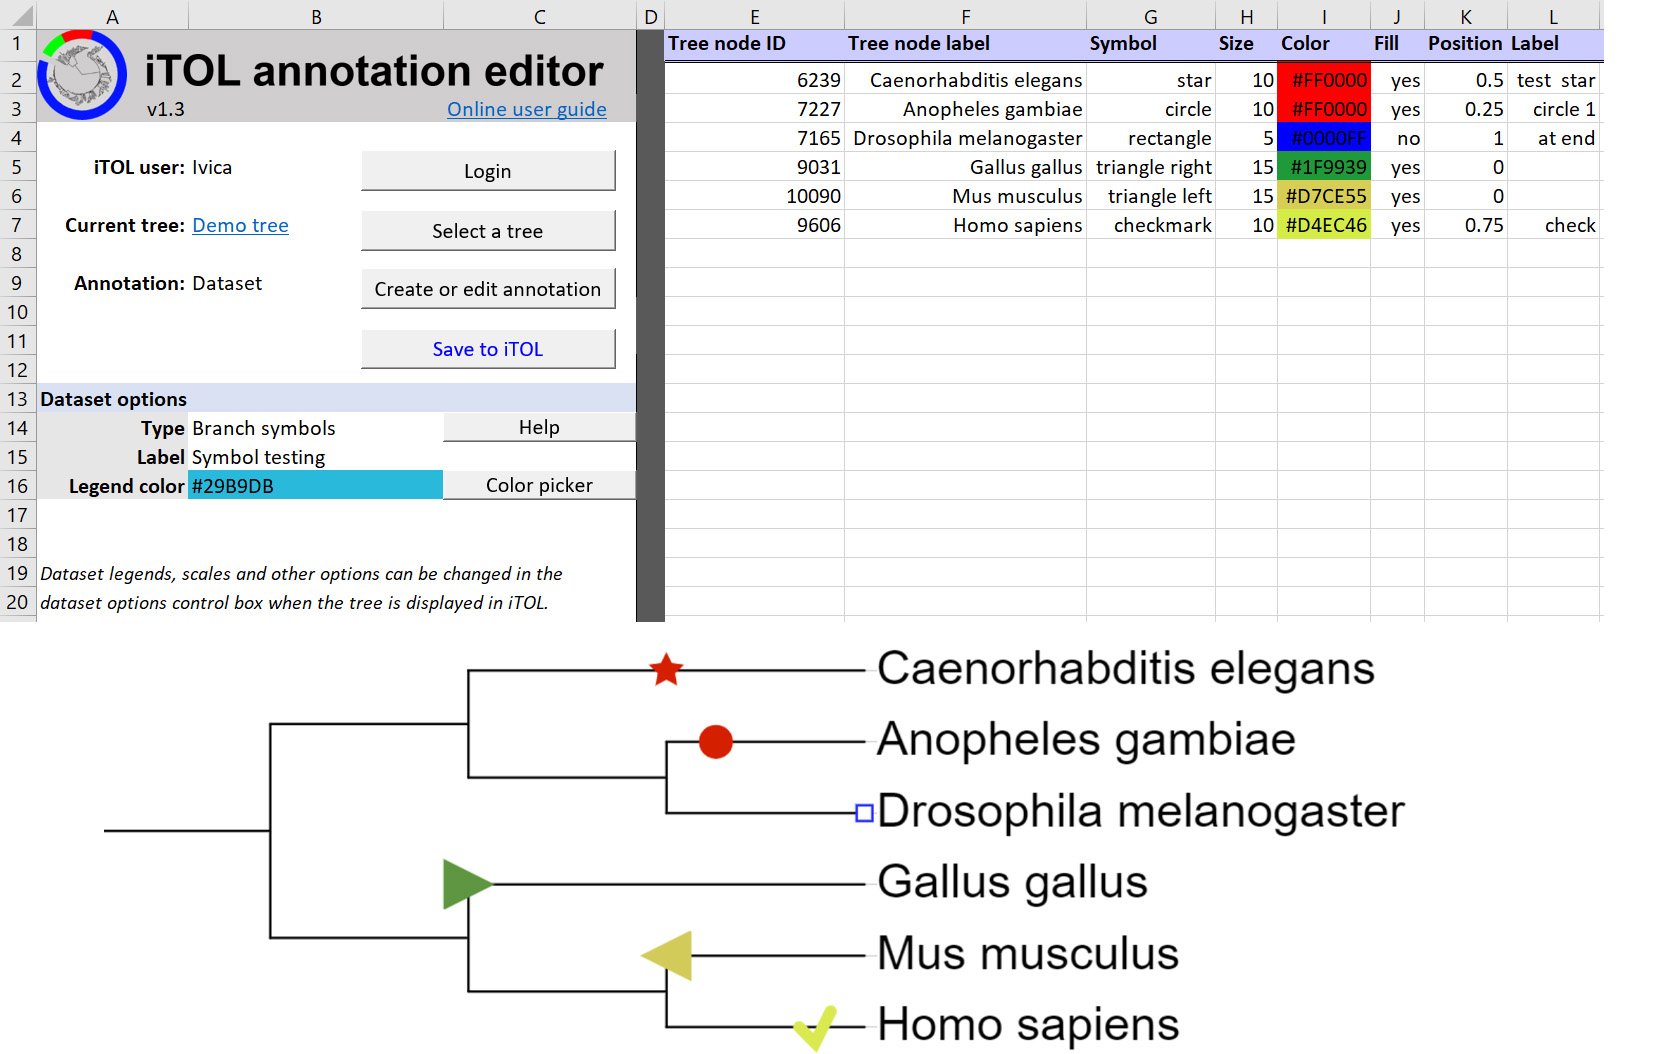
Example branch symbols
Protein domain datasets are visualized as schematic representations of proteins, with a protein backbone and various shapes depicting the locations of individual domains. Even though its primary use is for the display of protein domains, it can be used for various other purposes. Each node can have one protein definition assigned, with an unlimited number of domain definitions. Each domain definition consists of 5 parts, separated with vertical lines:
SHAPE|START|END|COLOR|LABEL
Use the Define a domain button (below the Color picker button), to display the domain definition creator, providing a simple interface for defining single domains. You can also write the definitions manually, please check the iTOL help page for the full list of domain shape codes.
Column descriptions:
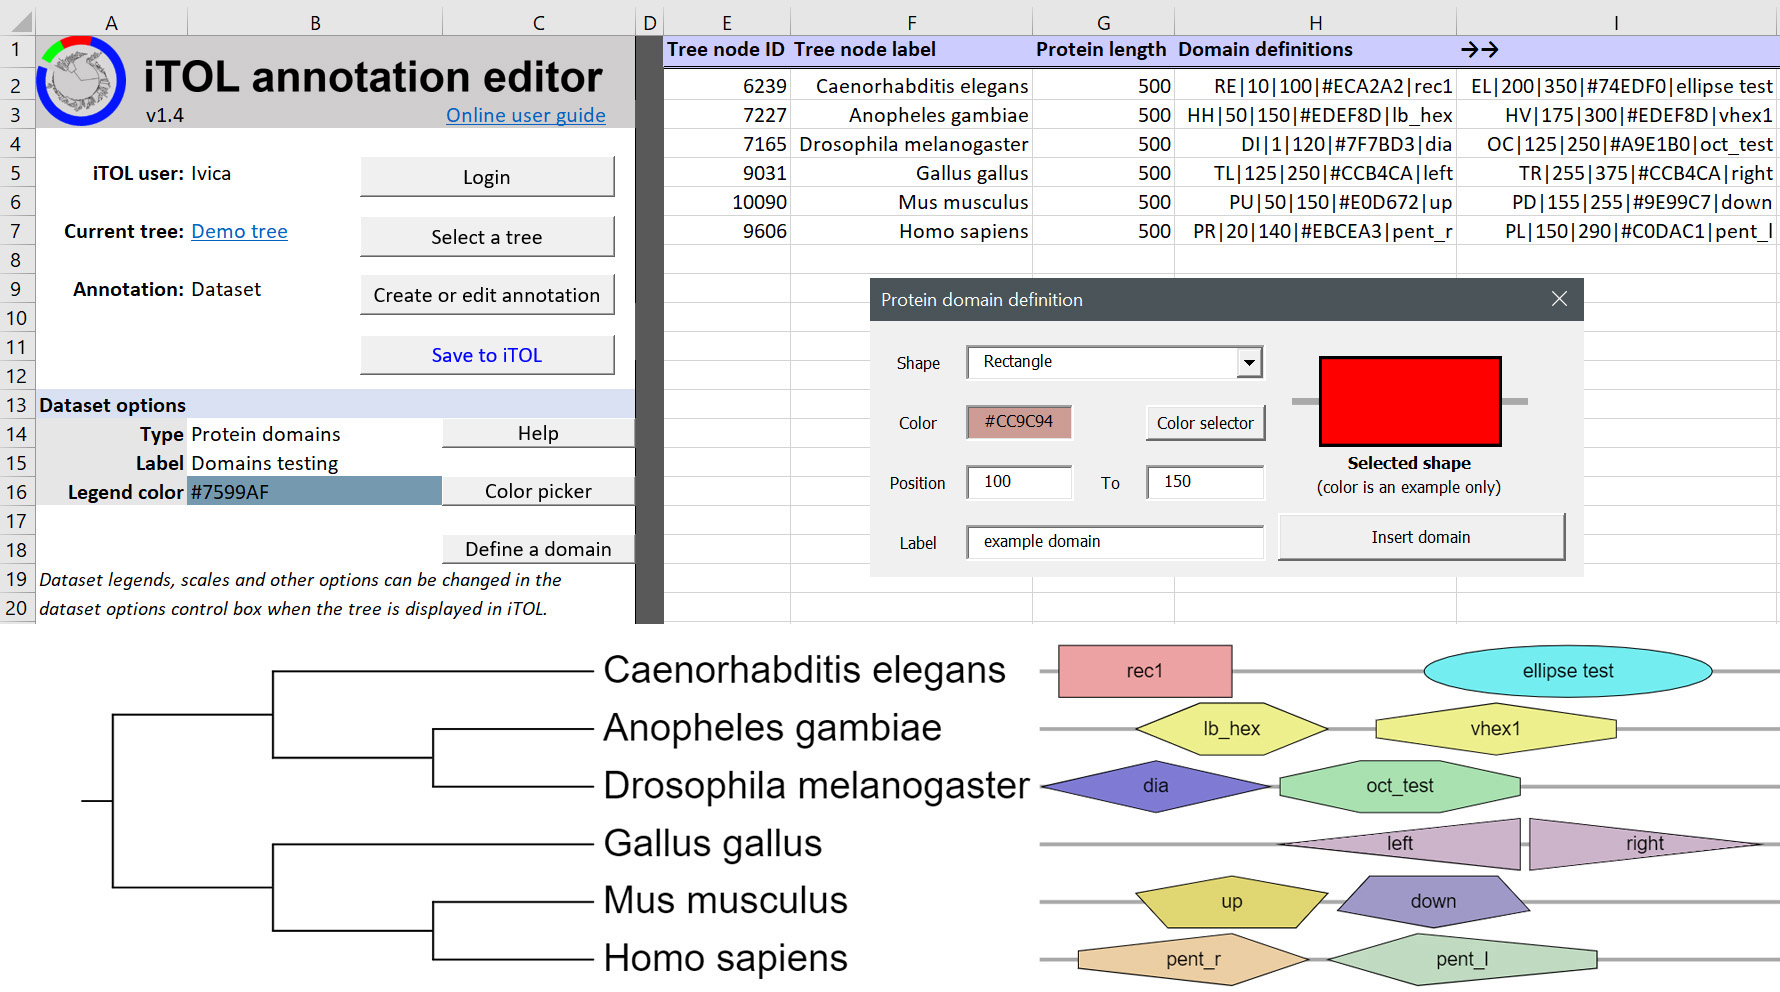
Example protein domains
If any problems are detected in your data when saving to iTOL, you will get an error message and an Error navigator dialog will be displayed, shown on the right. In addition, up to 30 error cells in your sheet will be highlighted in red, and will display the actual error message when selected. Due to Excel limitations, only 30 errors can be highlighted at once.
You can use the Previous and Next buttons to quickly navigate among the cells which contain errors. After correcting all the problems, you can save the data to iTOL.
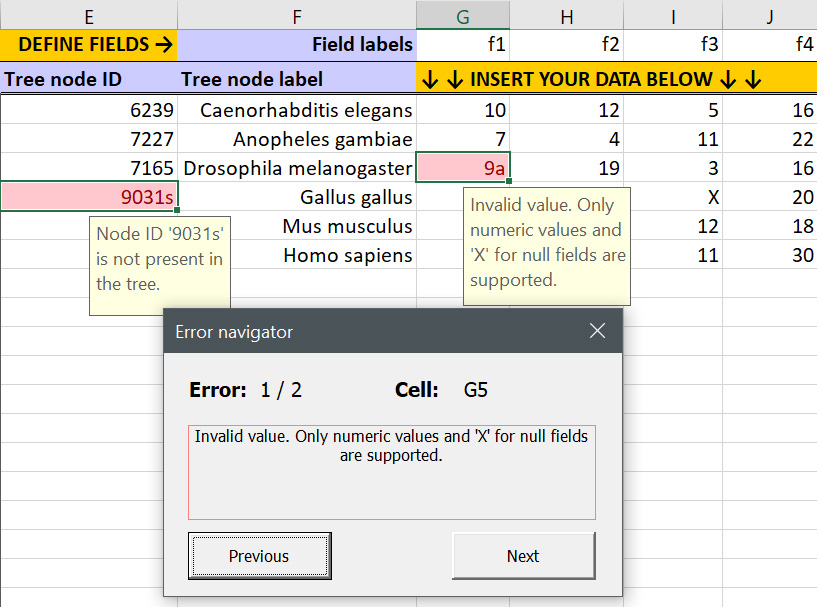
Error navigator
If you want to try the steps shown in the tutorial, you can download the phylogenetic tree and the example dataset and upload them to your iTOL account. Please check the iTOL help page if you need assistance with uploading, or contact me directly.