This page covers the usage of iTOL annotation editor for Google Sheets, and only highlights the major differences from the Microsoft Excel version. Please also visit the main help page for detailed description of various datasets and other annotation options.
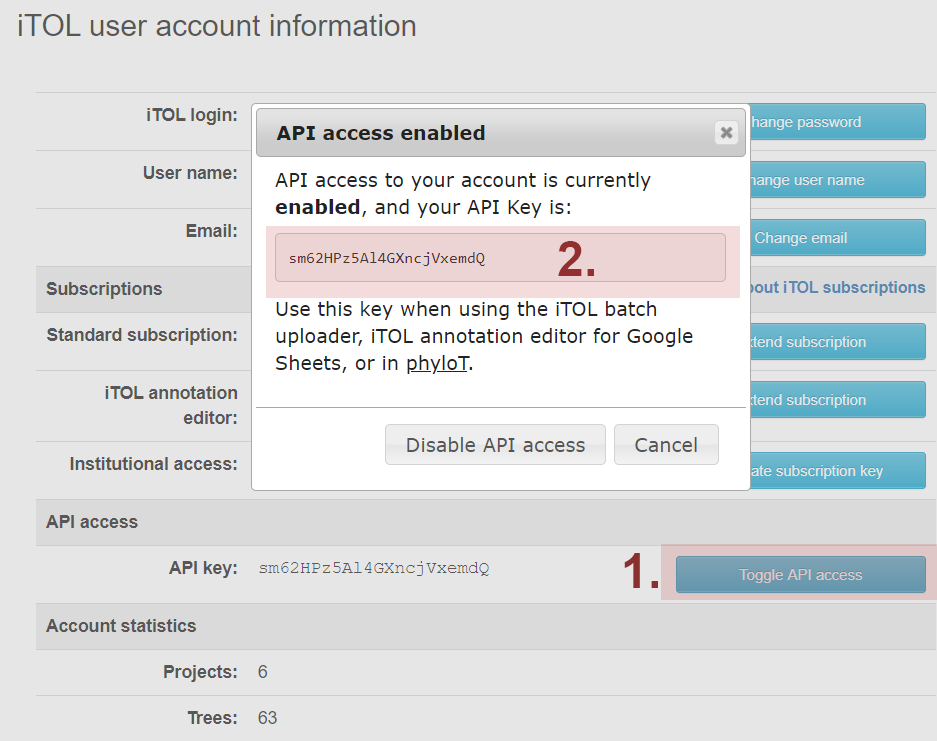
Getting the iTOL API access key
Create a new spreadsheet in Google Sheets, and access the iTOL annotation editor through the Add-ons menu.
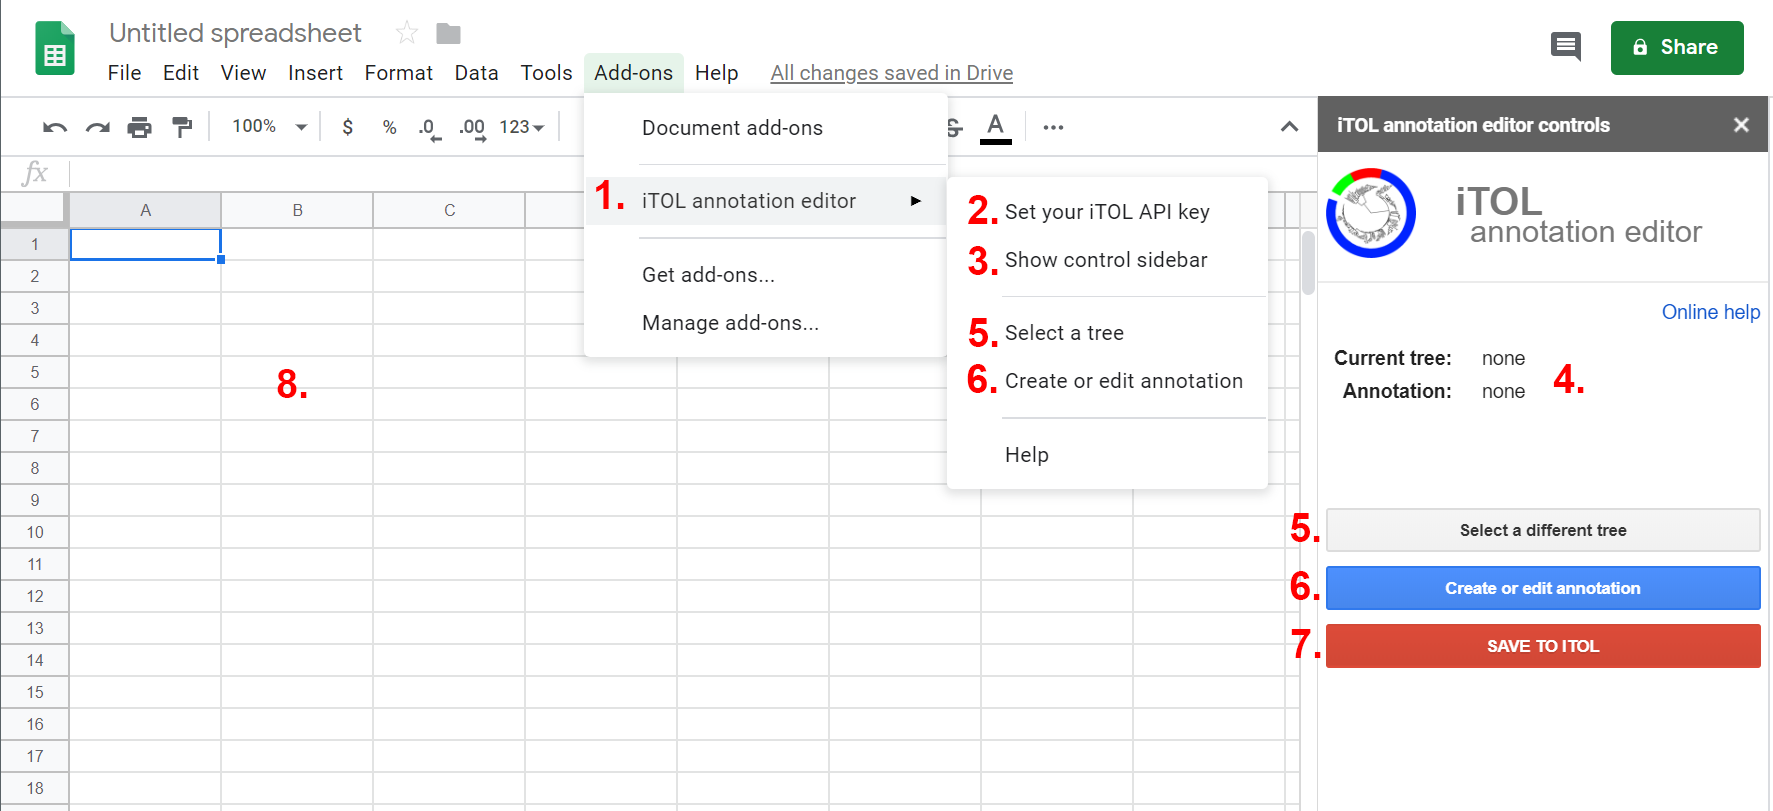
Annotation editor user interface
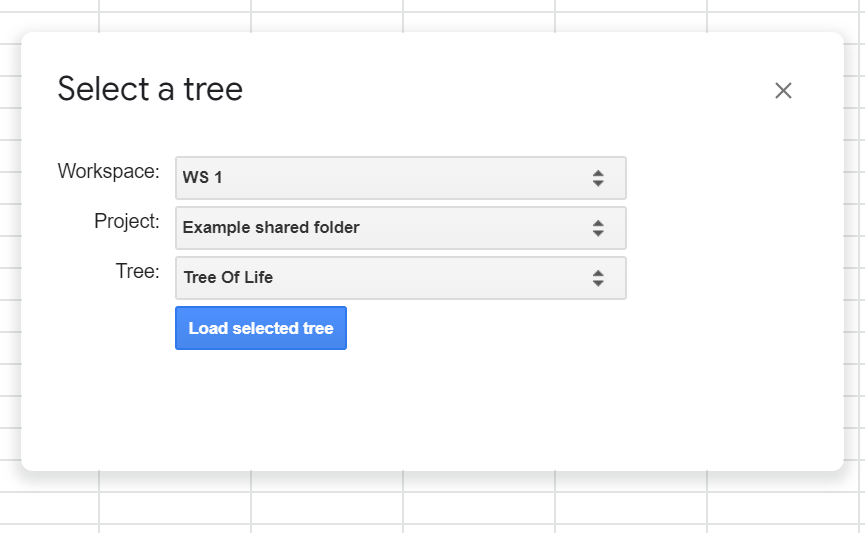
Selecting a tree from your iTOL account
After selecting a tree from your account, click the 'Create or edit annotation' button (or use the corresponding add-on menu item) to display the dialog shown on the right. It consists of 5 tabs:
There are two checkboxes available:
Select the desired function and click the button in the annotation selector to initialize the sheet editing area and the dataset options.
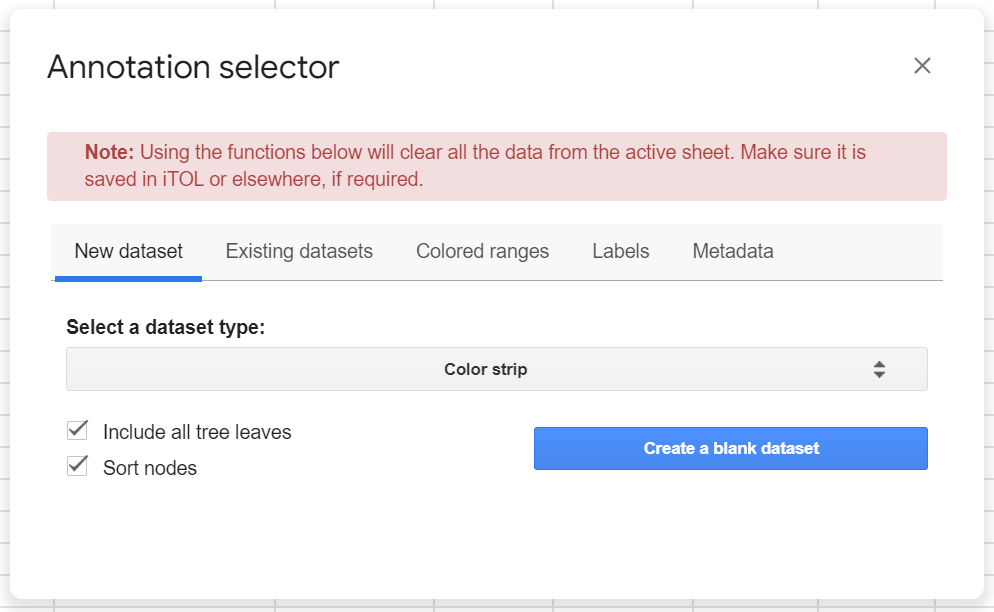
Annotation selector
After selecting the annotation type to edit, the editing area will contain the header describing the columns. Column A will always contain the tree node IDs. Type the node ID you wish to annotate into column A, and fill other columns as required (depending on the dataset type, described below).
If you pre-loaded the tree leaf IDs from iTOL, or if you are editing an existing dataset, column B will contain the current node labels (which can differ from the ID). These are displayed for your information only, and do not need to be filled otherwise. If you wish to edit the actual labels, use the 'Labels' tab in the Annotation selector.
When finished with editing, click the Save to iTOL button. If editing an existing dataset or tree labels, a warning message will be shown, to prevent you from accidentally overwriting the current data in iTOL.
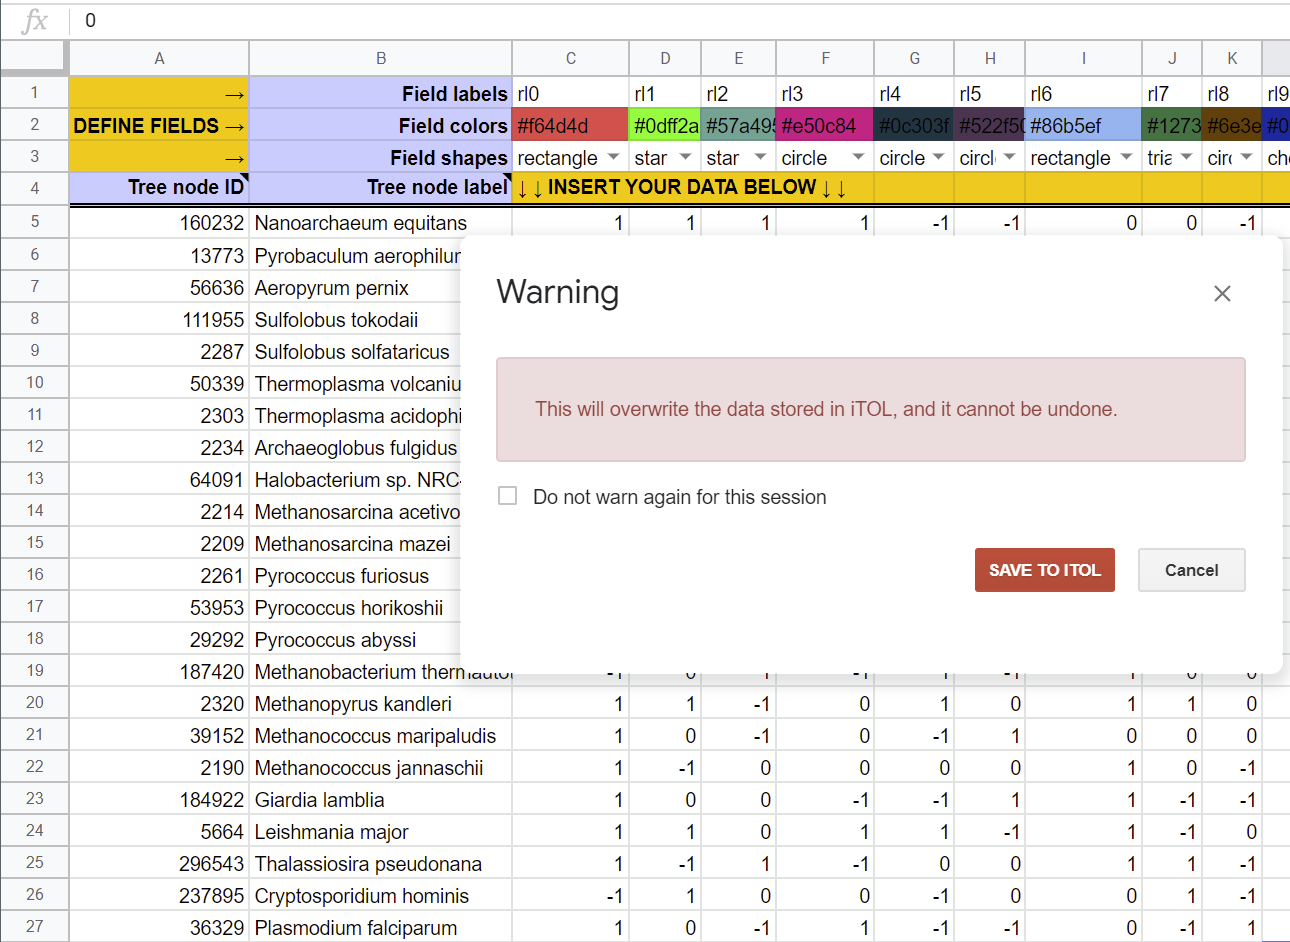
Data overwrite warning
If you don't have an active subscription or institutional access, iTOL annotation editor will function in trial mode. All functions are available for testing, with one important limitation: only the first 5 rows of your data will be processed and saved on the iTOL server. Existing data in iTOL will be overwritten with these 5 rows, and the rest will be deleted. For example, if you are editing the labels on a large tree, only the first five labels will be saved, and the rest will be gone.
In trial mode, please use separate trees and data uploaded specifically for evaluating the iTOL annotation editor, since data truncation could occur.
To get full unlimited access, visit your iTOL account page.
For unlimited institutional access, have your librarian or other responsible person get in touch with us.
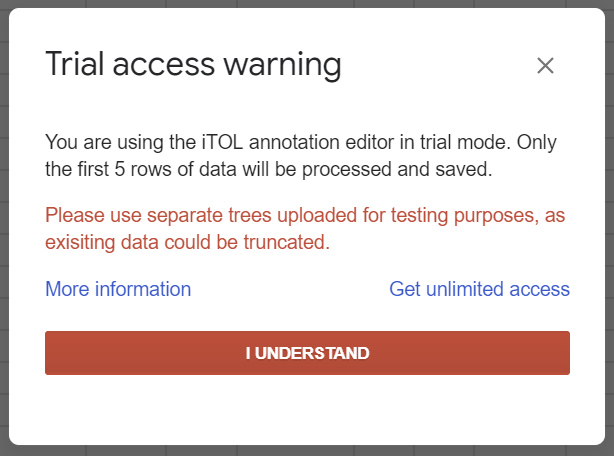
Trial usage warning
Select Labels tab in the Annotation selector and load the tree labels into the active sheet. Tree IDs will be in column A, and their corresponding label in column B. To assign labels to internal nodes, use iTOL's last common ancestor method, if your tree does not have internal node IDs present. Alternatively, you can click on any node in the iTOL web tree display, and click the node ID on the bottom of the popup to copy it to your clipboard. Paste it into the Tree node ID column, and assign the desired label.
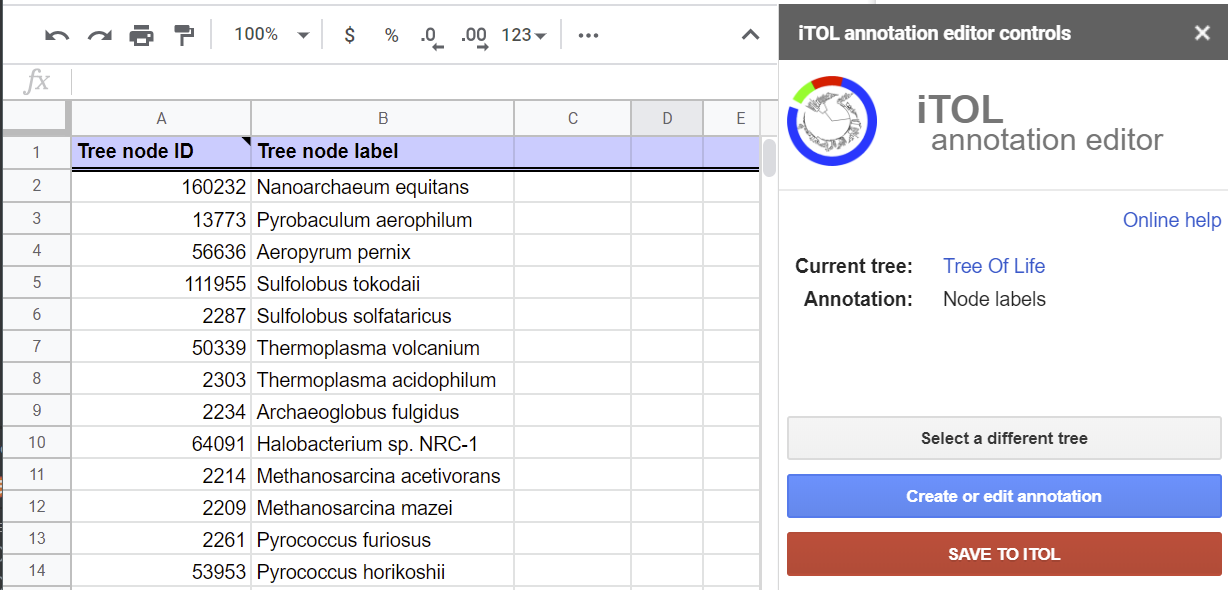
Editing tree labels
Select Metadata tab in the Annotation selector and load the node metadata into the active sheet. Tree IDs will be in column A, and their corresponding label in column B. Each node can have multiple associated metadata fields, which you have to define in the header starting with column C.
To assign metadata to internal nodes, use iTOL's last common ancestor method, if your tree does not have internal node IDs present. Alternatively, you can click on any node in the iTOL web tree display, and click the node ID on the bottom of the popup to copy it to your clipboard. Paste it into the Tree node ID column, and assign the metadata into the corresponding columns (from C onwards).
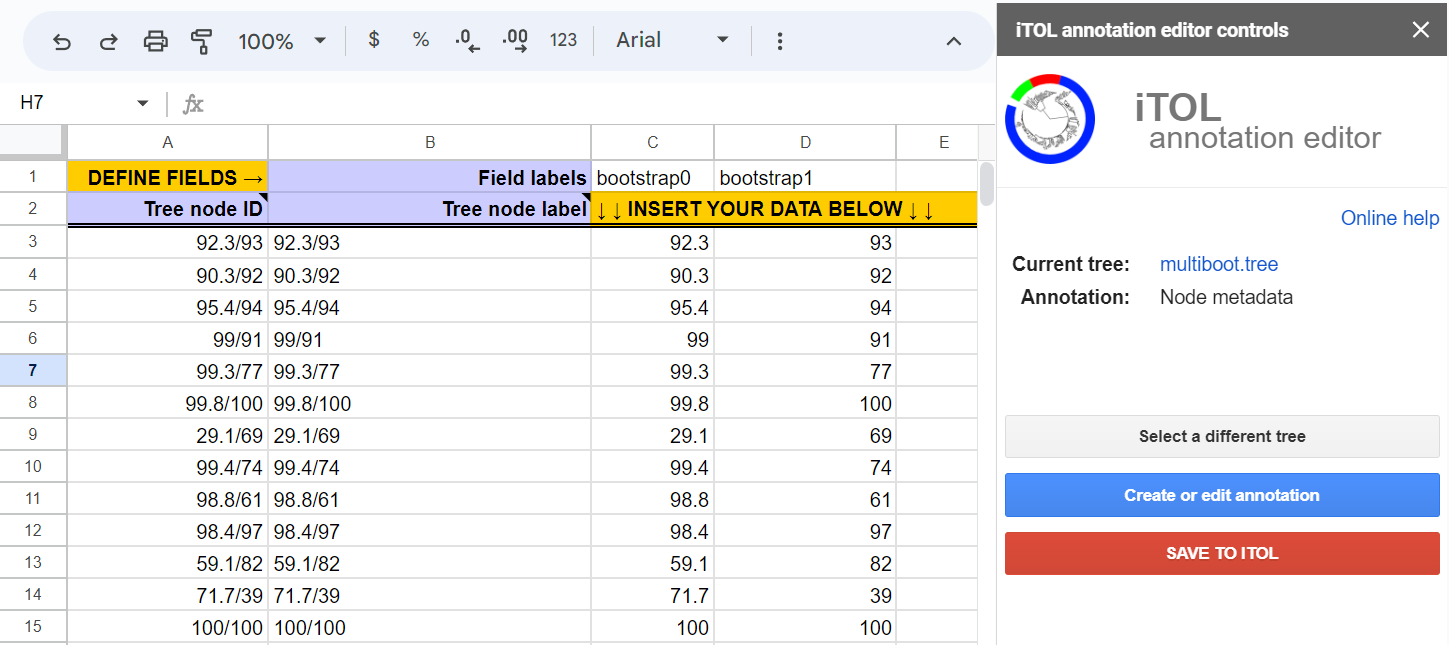
Editing node metadata
Note that these legacy colored ranges have been deprecated. New Colored/labeled ranges dataset offers the same features, with many additional functions.
Select Colored ranges tab in the Annotation selector and load the current ranges into the active sheet, or to initialize an empty color range input sheet. Tree IDs have to be entered into column E, and their corresponding range color into column G. You can also provide the label for the colored range in column H.
To assign colored ranges to internal nodes/clades , use iTOL's last common ancestor method, if your tree does not have internal node IDs present (row 4 in the example on the right). Alternatively, you can click on any node in the iTOL web tree display, and click the node ID on the bottom of the popup to copy it to your clipboard. Paste it into the Tree node ID column, and assign the desired colored range.
Whenever you need to provide a color annotation, you can type it directly into the cell, using any iTOL supported format ( hexadecimal, RGB or RGBA). Alternatively, you can use the Color picker button in the control sidebar. Select a cell where you need a color, and click the Color picker button. After selecting a color, its hex code will be entered into the active cell, and the cell background will reflect the selected color.
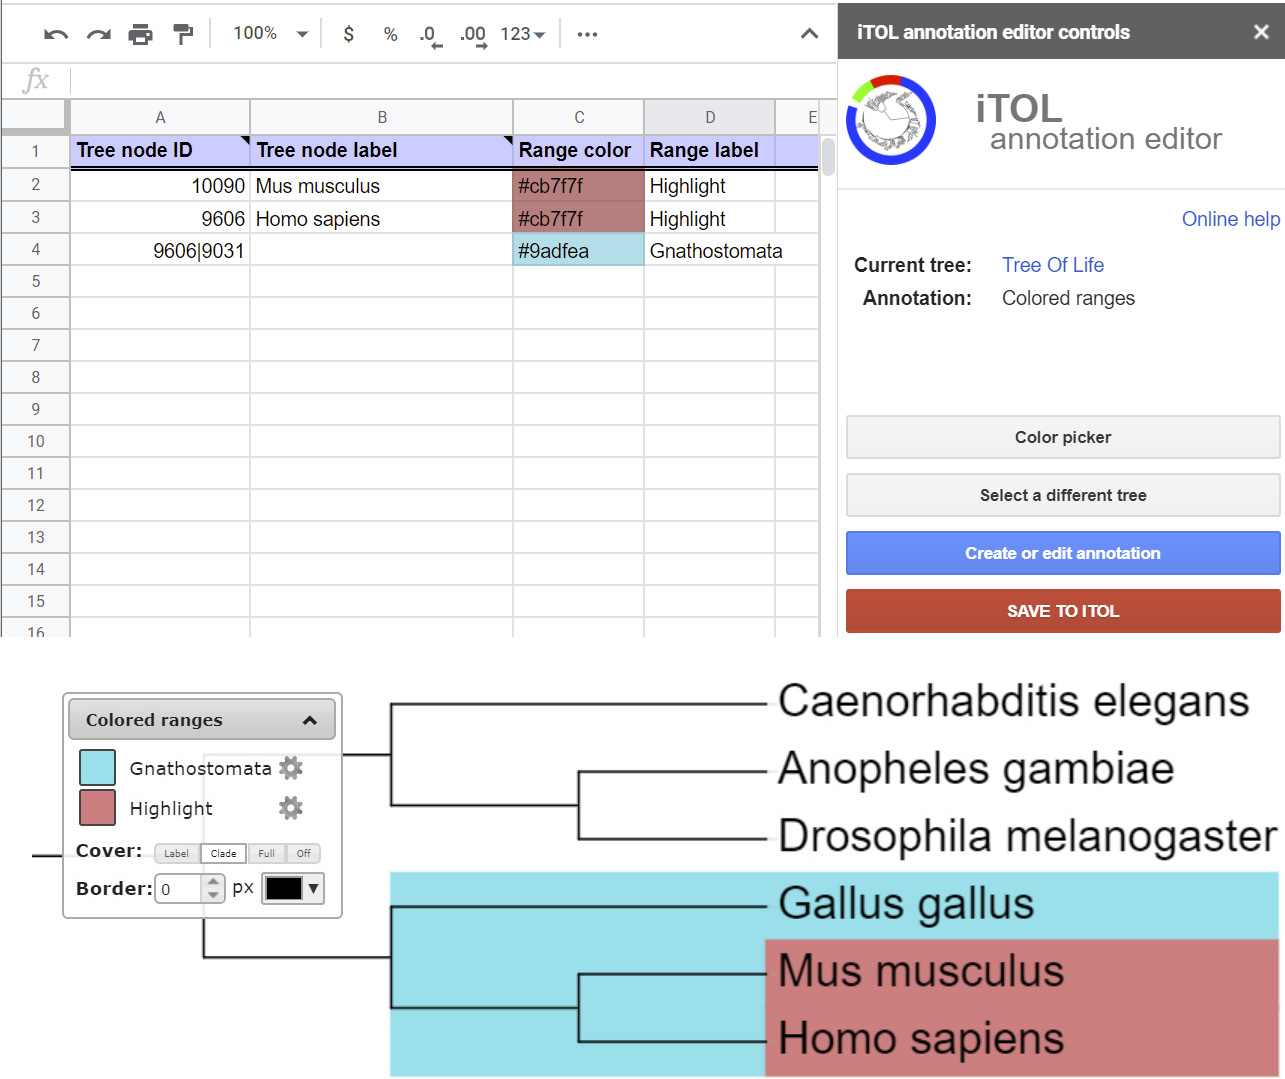
Editing colored ranges
To create a new blank dataset, go to the New dataset tab in the Annotation selector, choose the desired dataset type and options, and click Create a blank dataset.
If your tree already has some datasets present, you can load and edit them through the Existing datasets tab.
Tree IDs have to be entered into column A, and their corresponding data into columns C and onward, depending on the dataset type. To assign data to internal nodes/clades , use iTOL's last common ancestor method, if your tree does not have internal node IDs present. Alternatively, you can click on any node in the iTOL web tree display, and click the node ID on the bottom of the popup to copy it to your clipboard. Paste it into the Tree node ID column, and assign the data as required.
Dataset label and legend color must be set (or can be changed for existing datasets) in the control sidebar, above the function buttons.
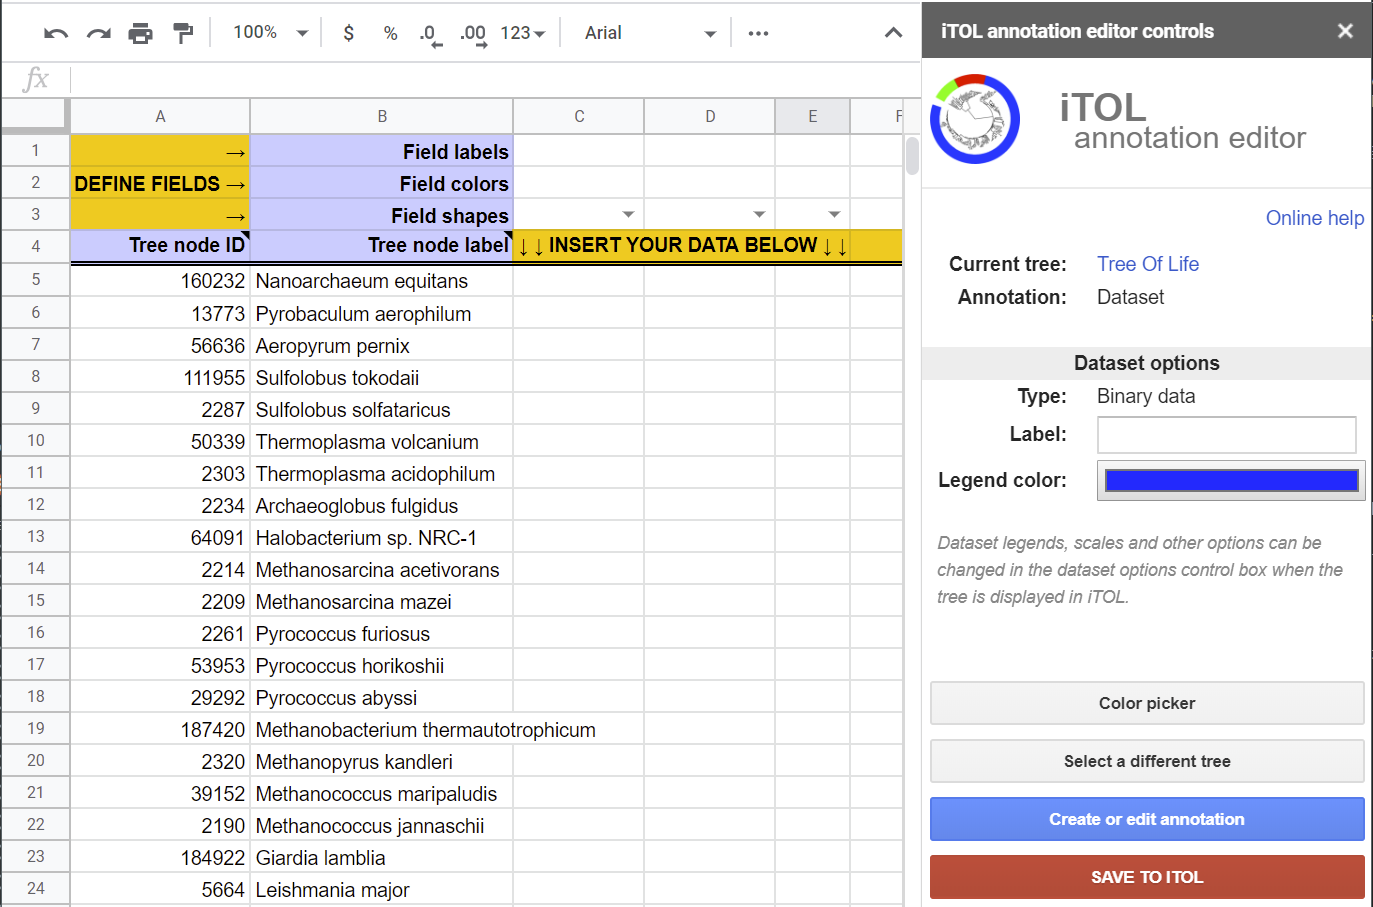
Blank dataset template
All available dataset types are described in the detail on the main iTOL annotation editor help page. The descriptions of columns refer to the Microsoft Excel version, where the data is entered from column E onwards. In the Google Sheets version, all data is entered from column A onwards.
Video tutorial demonstrates the usage of the Microsoft Excel version of the editor, but apart from different positions of various control buttons, all the functionality is identical. If you want to try the steps shown in the tutorial, you can download the phylogenetic tree and the example dataset and upload them to your iTOL account. Please check the iTOL help page if you need assistance with uploading, or contact me directly.